Fig. 3.

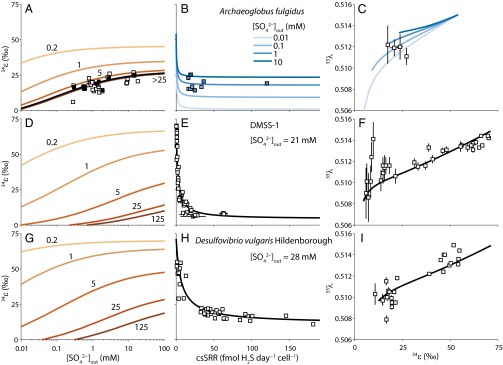
Model calibration to experimental data. (A) Net isotopic fractionation by A. fulgidus grown at 80 °C at constant csSRR (6, 7) as a function of extracellular sulfate concentrations . Orange contours show the value of for different values of csSRR in fmol H2S⋅cell−1⋅d−1. The black curve shows for the harmonic mean of the csSRR values that were reported for some of the experiments (black squares). The csSRR values were not reported for other experiments (white squares), resulting in the scatter around the black curve. (B) Predicted as a function of csSRR for between 10 μM and 100 mM. Experiments for which , csSRR, and were all reported are also shown, color coded by . (C) Predicted fractionation exponent as a function of for the same as in B. Experiments for which minor isotope data exist are also shown (14). (D) Predicted relationship for Desulfovibrio strain DMSS-1 grown at ∼20 °C, 21–14 mM , and 2–7 mM sulfide (8–10). (E) Measured (white squares) and model (black curve) vs. csSRR for the experiments in D. These experiments were run in batch culture, so we assumed the average and external sulfide concentrations for the interval over which vs. csSRRs were determined (SI Materials and Methods). (F) vs. for the experiments in D. Error bars are 1σ reported in the experiments. (G–I) Same as D–F, but for D. vulgaris Hildenborough, grown at 25 °C and with precisely controlled of 28 mM (11). Sulfide concentrations for the model curves were assumed to be 0.1 mM.
