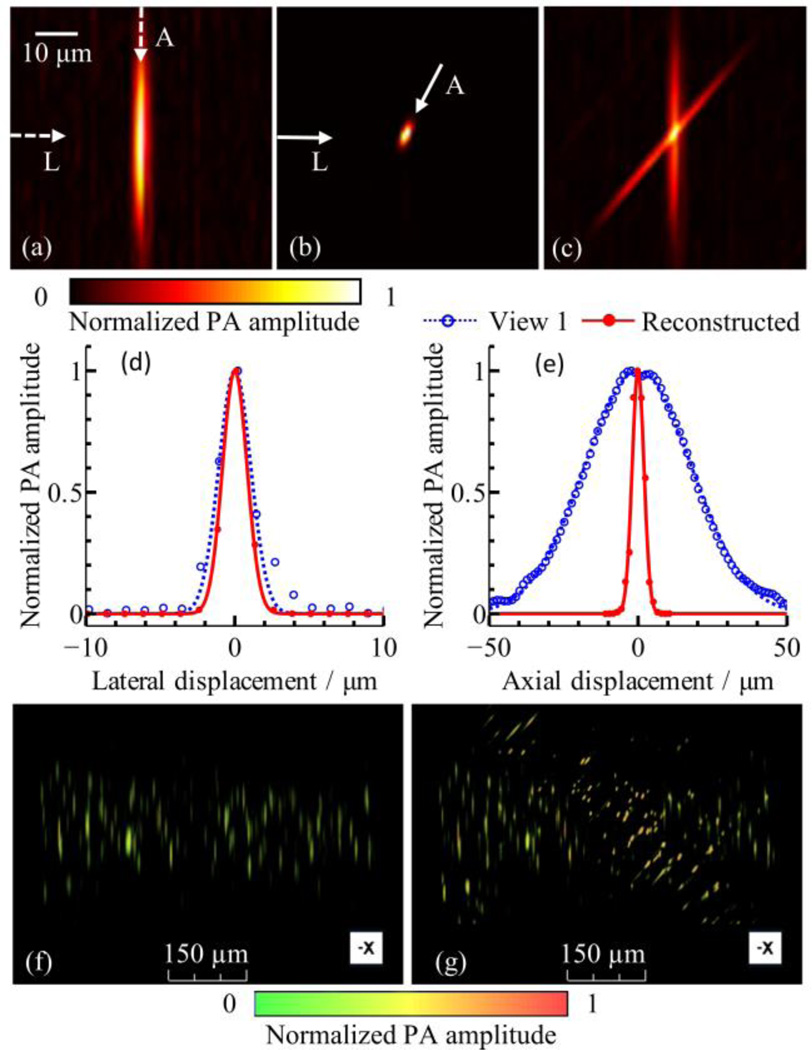
Fig. 4.
Quantification of improvement of axial resolution and resolution isotropy. Image slices perpendicular to rotation axis (original B-scan plane) from (a) single view and (b) reconstructed 3D volume data. (c) Arithmetic fusion of the two views at the same area as (a) and (b), showing overlap between the two views. (d) Lateral line profiles from single view and reconstructed volume, indicated by the horizontal arrows marked as “L” in panels (a) and (b). (e) Axial line profiles extracted along the depth direction from single view image (a) and along the worst-resolution direction from the reconstructed image (b), both marked as “A”. (f), (g) Volumetric rendering of single-view dataset and reconstructed dataset. See Media 1 for a full view angle rendering of these two data sets.

