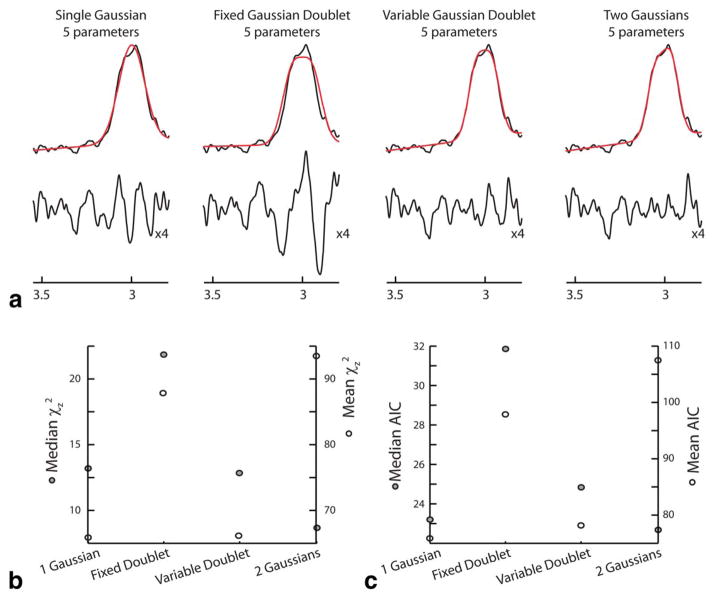
Figure 5.
Model Comparison. All data were fit by four models: single Gaussian, fixed Gaussian doublet; variable Gaussian doublet; and two free Gaussians. Data for a representative dataset are shown in (a) with fits in red and residuals (expanded vertically by four) below. b: Mean (white points, right-hand axis) and median (gray points, left-hand axis) χz2 values over all 120 datasets. c: Mean (white points, right-hand axis) and median (gray points, left-hand axis) AIC values over all 120 data-sets. [Color figure can be viewed in the online issue, which is available at wileyonlinelibrary.com.]

