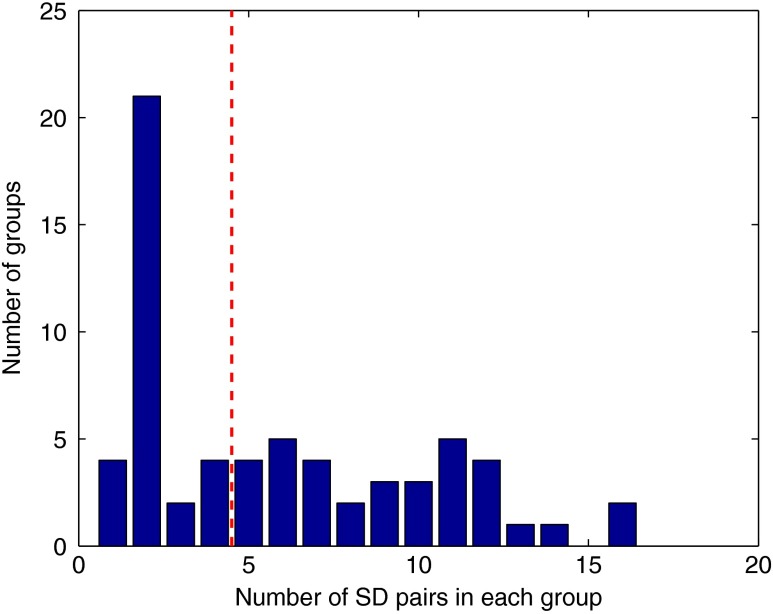
Fig. 7.
Histogram of optimal source-detector pair sensitivity groupings, displaying the amount of source-detector pairs required on each optimal group so that each group’s sensitivity achieves maximum correlation to the group’s corresponding EEG electrode. A subset of 65 electrodes was selected for this calculation based on the EEG 10-10 positioning layout. The red dashed line displays the threshold for the optimal groups chosen.

