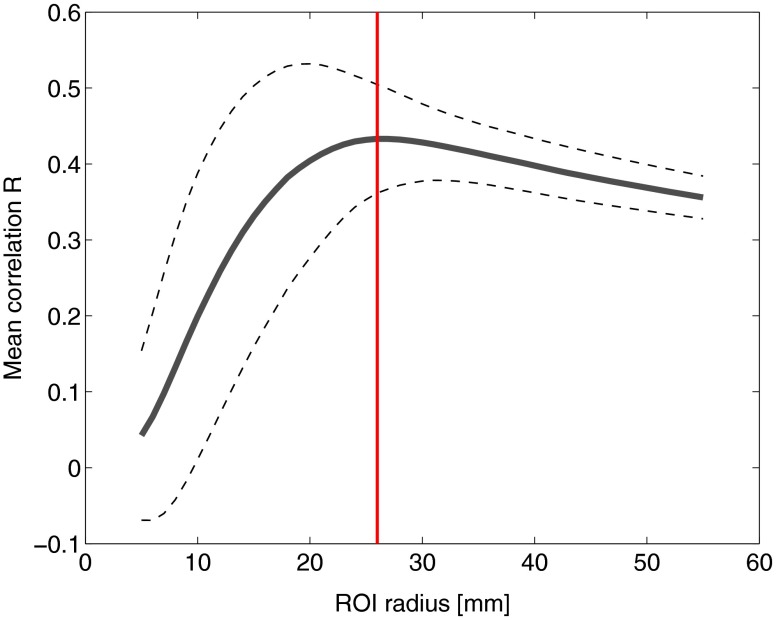
Fig. 9.
Mean (bold line) and standard deviations (dashed lines) of the region of interest correlation between NIRS source-detector pair inverse model and EEG electrode inverse model for each ROI radius. The maximum mean correlation was obtained at a radius of 26 mm as marked with the vertical red line.

