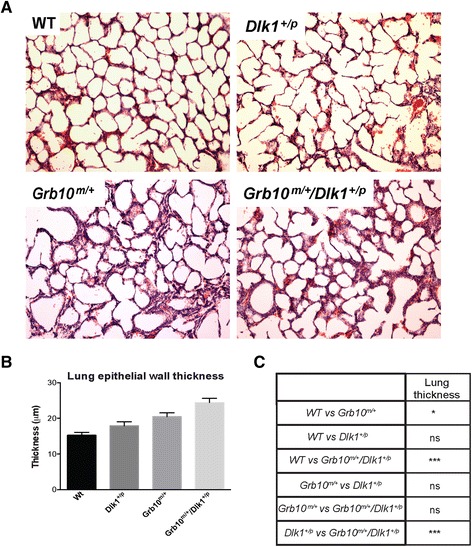
Figure 9.

Histological and morphometric analyses of neonatal lungs. A) Thickened epithelial walls were observed in Grb10 m/+ and Grb10 m/+ /Dlk1 +/p lungs, while Dlk1 +/p lungs displayed normal histology when compared to wild type littermates. The presented images are representative sections for each of the analysed genotypes (100x magnification). B) These observations were confirmed by morphometric analysis of epithelial wall thickness using images captured at 200x magnification. C) Table summarising results of statistical analysis of morphometric data. All values represent means ± SEM, analysed using one way ANOVA with Tukey’s post-hoc analysis. WT n = 5, Dlk1 +/p n = 5, Grb10 m/+ n = 5 and Grb10 m/+ /Dlk1 +/p n = 5; * P <0.05; *** P <0.001. ANOVA, analysis of variance; SEM, standard error of the mean; WT, wild type.
