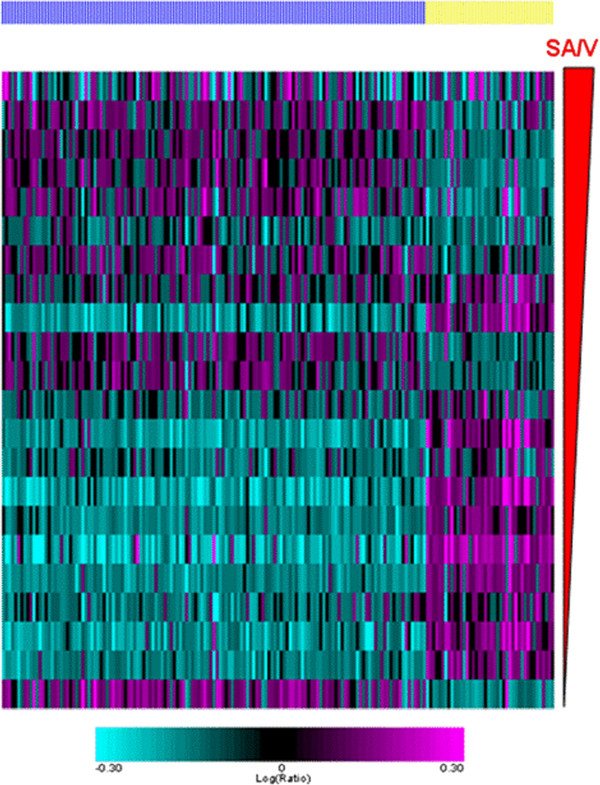
Figure 2.

A heat map shows the relationship between the level of expression of the 181 SA/V-correlated genes (columns) for the 22 samples in the replication set. The samples are shown in rows ordered by increasing SA/V. Genes whose expression was negatively related to SA/V are shown by the yellow bar while those whose expression was positively related to SA/V are indicated with the blue bar. The pattern is similar to the discovery set.
