Figure 4.

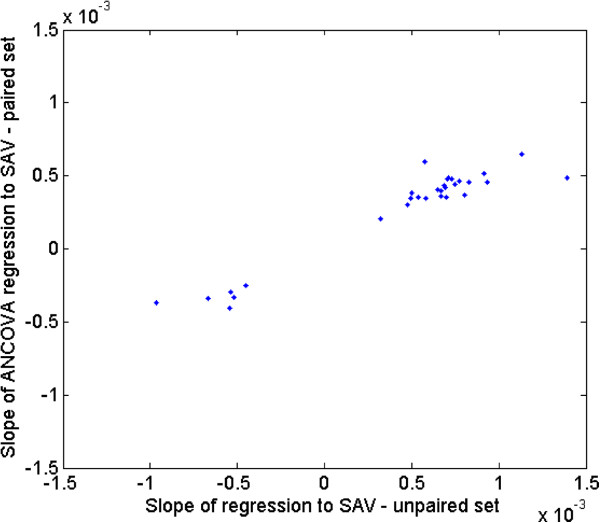
Slopes of regression for the 30 genes that replicated at p < 0.05 in the replication data set. The slopes for the replication data are on the x axis and those from the discovery set are on the y axis.

Slopes of regression for the 30 genes that replicated at p < 0.05 in the replication data set. The slopes for the replication data are on the x axis and those from the discovery set are on the y axis.