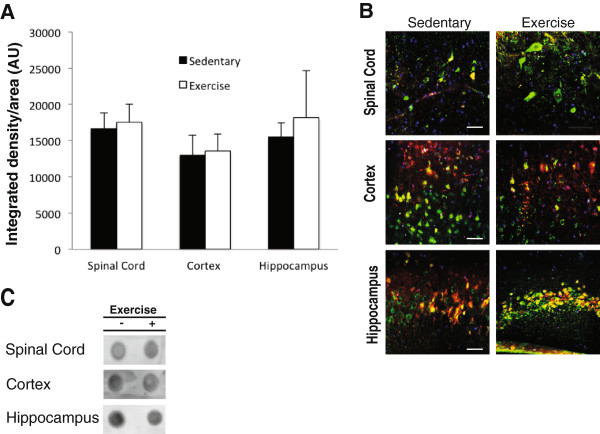
Figure 5.

Soluble tau oligomers are present in the spinal cord and brain of P301S mice. A) Dot blot analysis indicates similar levels of oligomeric tau in the spinal cord, cortex, and hippocampus. B) Representative images of immunofluorescence of the spinal cord, cortex and hippocampus revealed similar T22 staining in sedentary versus exercised mice. Scale bar represents 50 μM for all images. C) Representative dot blots of T22 in the spinal cord, cortex, and hippocampus. [N = 4 per group]. Blue, DAPI; green, TAU5; red, T22. A Student’s t-test was used to detect statistically significant differences.
