Table 3.
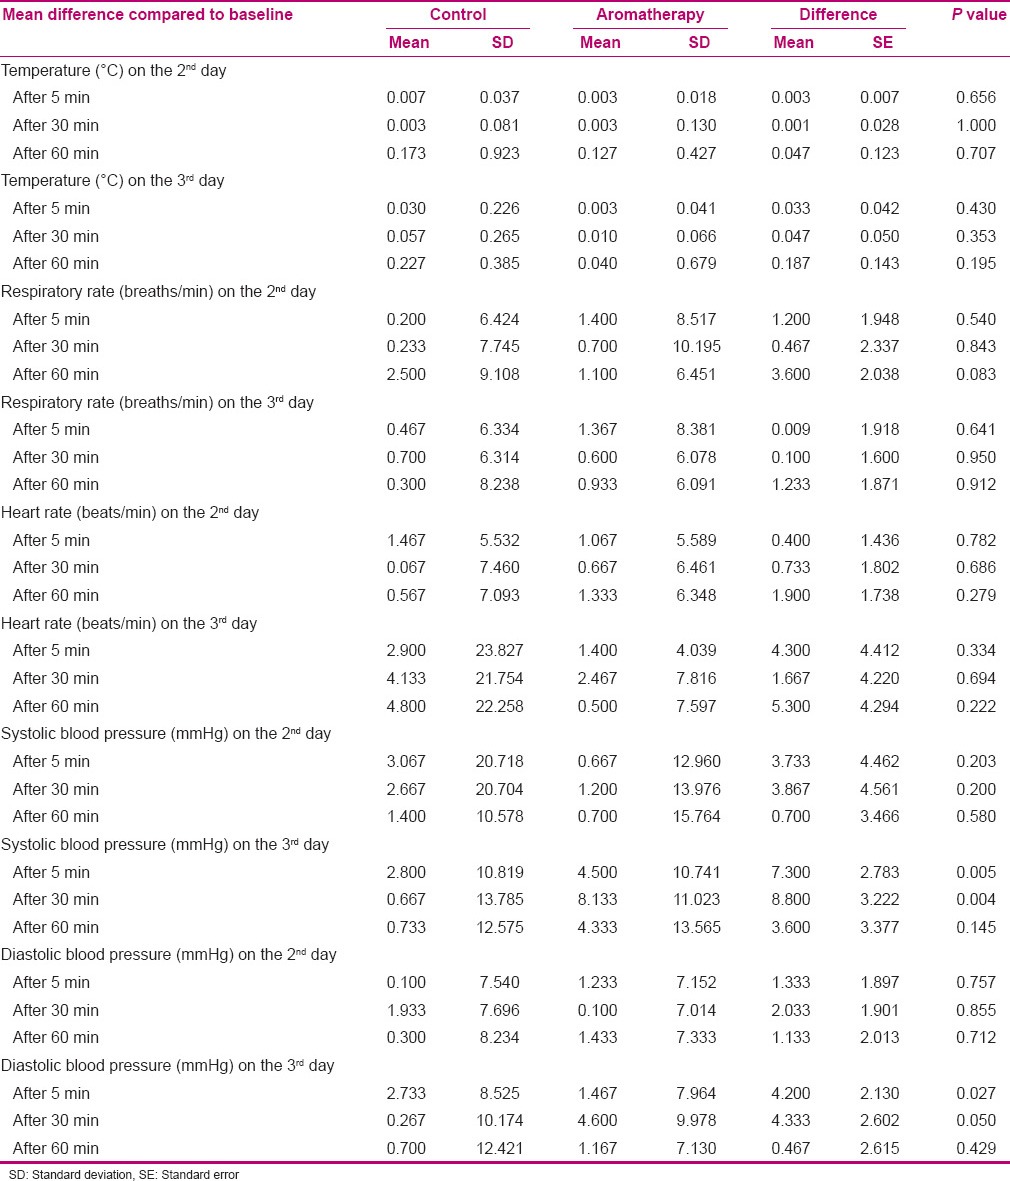
Comparison of the mean difference in homodynam ic measurements in intervention (lavender) and control (placebo) groups using independent t-test

Comparison of the mean difference in homodynam ic measurements in intervention (lavender) and control (placebo) groups using independent t-test
