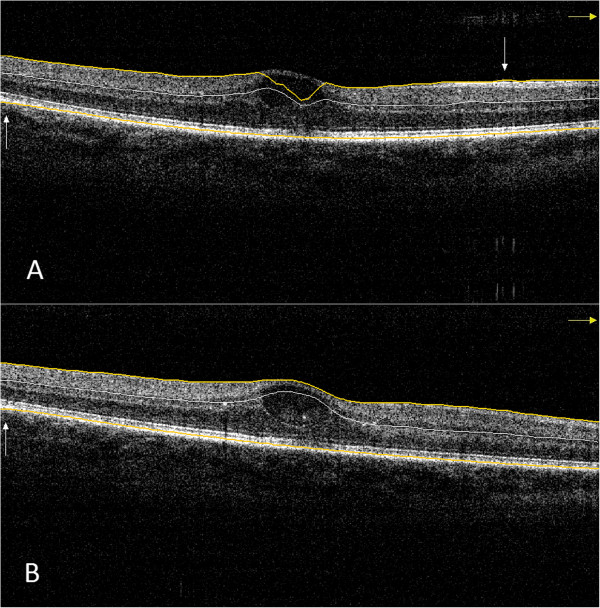
Figure 4.

Macular OCT scan of a subject with diabetic macular edema. (A) Image taken with suboptimal settings. (Signal strength index =70.4). Inner retinal misidentification is observable in the central region and outer retinal misidentification at the peripheral region of the scan. (B) Image taken with optimal settings. (Signal strength index =74.3). Outer retinal misidentification is observable at the peripheral region of the scan. Inner and outer retinal segmentation lines are highlighted with yellow color for better observation. Errors are signed with white arrows.
