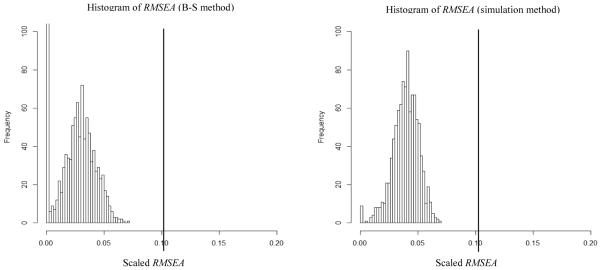
Figure 6.

Results for Example 3 (COERCE full sample). Left side graph is the histogram of RMSEAs using the Bollen-Stine method and the right side graph is the histogram of RMSEAs using the simulation method. MeanB-S = .027, MaxB-S = .070, Count (RMSEA = 0)B-S = 132, Meansimulation = .039, Maxsimulation = .070 and Count (RMSEA = 0)simulaiton = 7. The vertical reference line shows the value of the RMSEA (.101) in the analysis of empirical data.
