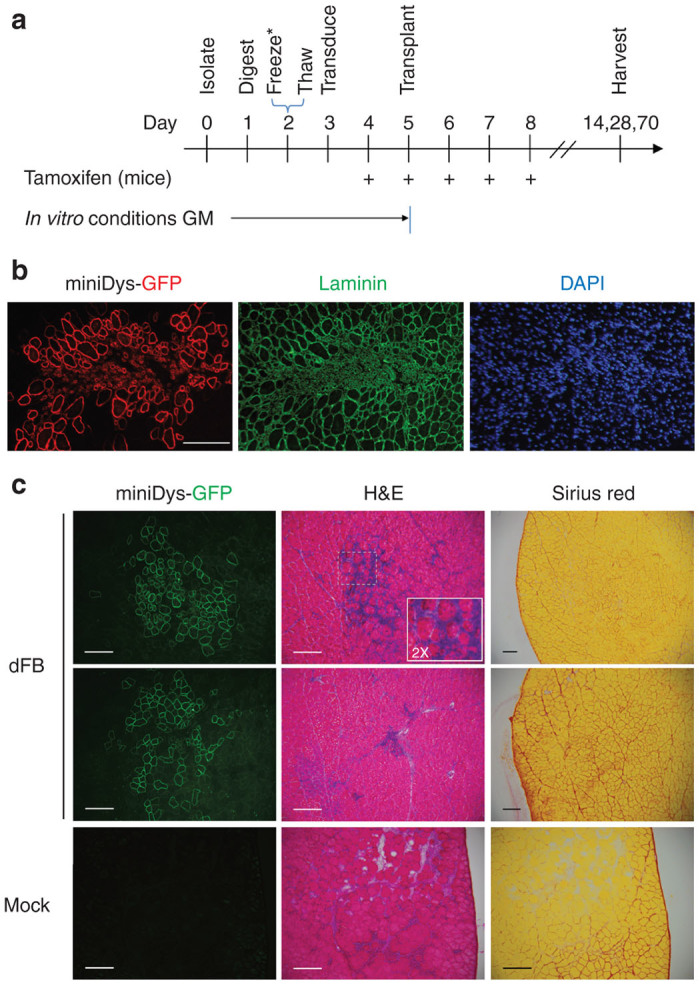
Figure 3.

In vivo conversion of dFbs derived from miniDys-GFP transgenic donors. (a) In vivo dFb conversion timeline. *Timeline represents a typical experiment; see the Materials and Methods section for slight variations and protocol details. GM, growth medium (see Materials and Methods). (b) A typical engraftment site in a TA muscle following in vivo conversion of dFbs 4 weeks posttransplantation, showing immunostaining for GFP to detect localization of miniDys-GFP, laminin to detect all muscle fibers and the structural characteristics at the engraftment site, and DAPI for detection of nuclei. (c) Features of engraftment sites. The left column is direct imaging of miniDys-GFP at engraftment sites. The middle and right columns are hematoxylin and eosin (H&E) and Sirius red staining, respectively, and show no gross abnormalities or ectopic collagen deposition following in vivo dFb conversion (top two rows). The inset in the top row H&E is twice the magnification of the original image. H&E and Sirius red staining of dFb transplanted muscles was similar to that of mock transplantations with saline (bottom row). Scale bars = 200 µm.
