Figure 5.

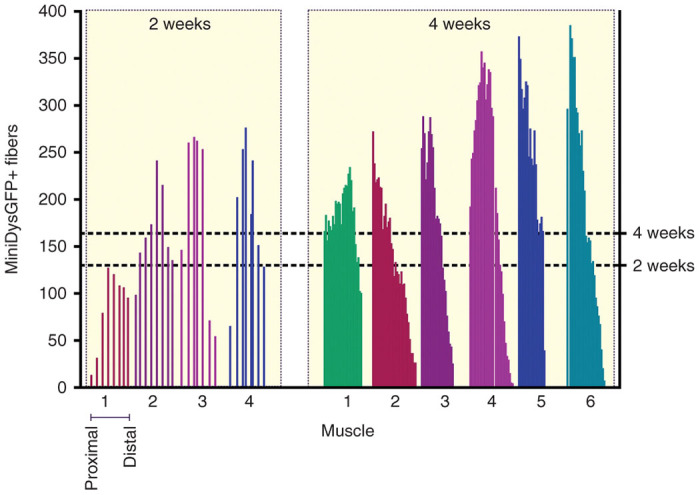
Profiles of engraftment for in vivo converted dFbs across TA muscles of mdx4cv hosts at 2 and 4 weeks. Each numbered bar plot on the x axis represents a single muscle, where each bar within plots indicates the number of GFP+ fibers per cross section. Cryosections were collected throughout each muscle, and counted approximately every 0.5 mm for the 2-week time point and every 0.1 mm for the 4-week time point and plotted from proximal (left) to distal (right). Note that the placement of each bar within plots reflects the actual section counted, and thus distances between bars are occasionally slightly variable (2-week time point), and in rare cases missing (4-week time point), due to unscorable sections. The right axis and dotted lines show mean positive fibers for each time point, where the 4-week time point had a slightly higher average number (164 positive fibers) than the 2-week time point (130 positive fibers), determined for each by averaging across all sections of all muscles.
