
Figure 4.
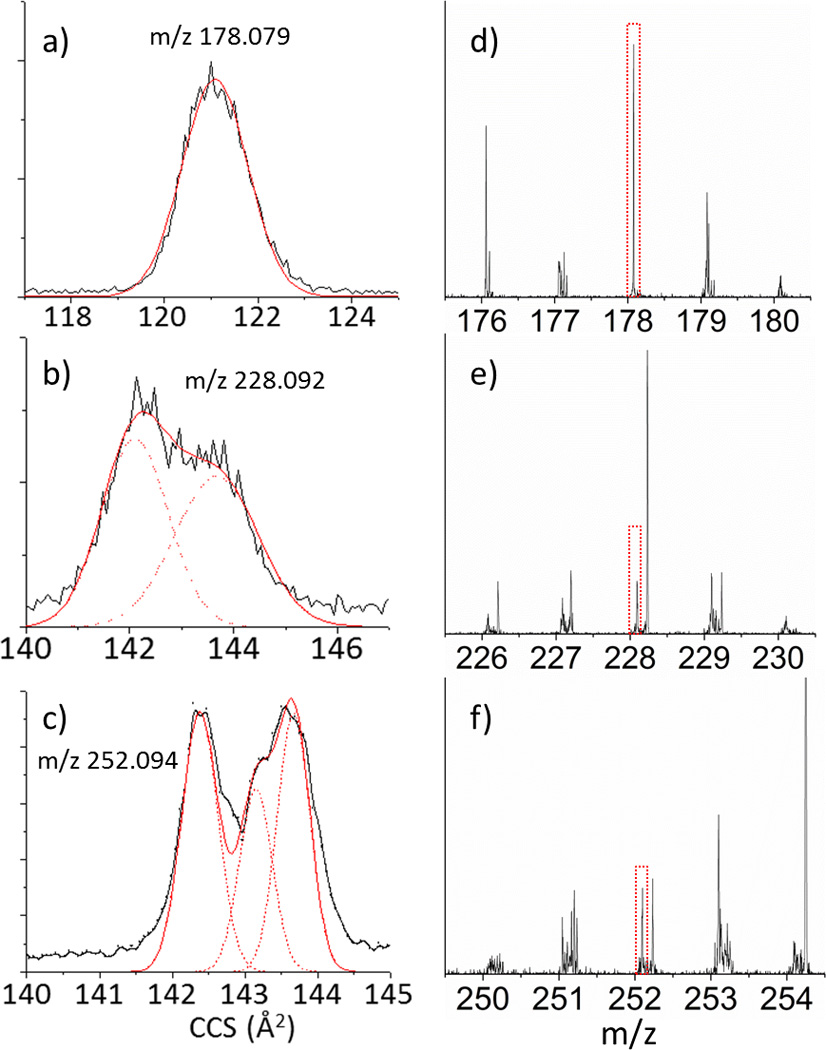
TIMS and MS projection plots for the insets shown in Figure 3 of the structural isobars a) Phenanthracene and Anthracene (not resolved), b) Chrysene (56%) and 1,2 Benzanthracene (44%), and c) Benzo(a)Pyrene (45%), Benzo(b)Fluoranthene(14%) and Benzo(k)fluoranthene (41%). d–f) Excerpts of the mass spectrum corresponding to the compounds in a–c.