Figure 2.

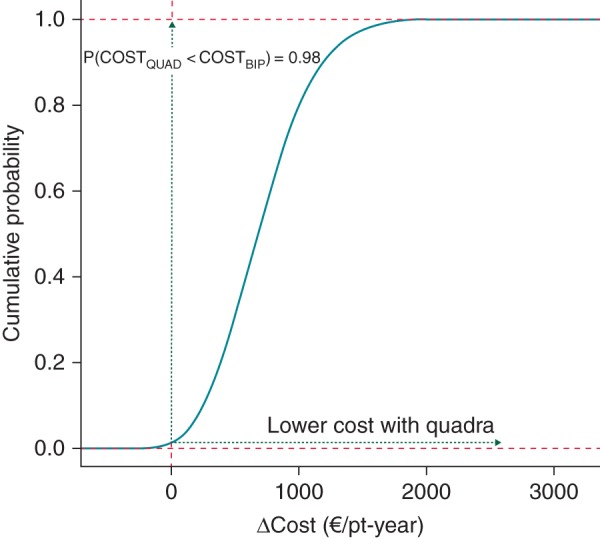
Cumulative probability function showing the likelihood of cost difference (ΔC) between treatment and control groups. ΔC = Cost difference. P(CostQUAD < CostBIP): Probability of cost for Quadra being lower than Bipolar.

Cumulative probability function showing the likelihood of cost difference (ΔC) between treatment and control groups. ΔC = Cost difference. P(CostQUAD < CostBIP): Probability of cost for Quadra being lower than Bipolar.