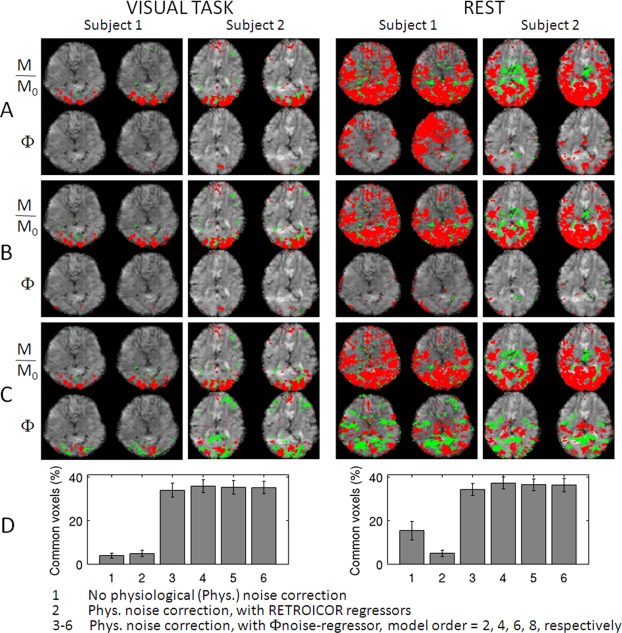
Figure 3.

The removal of background low‐frequency phase (Φ) variation increases the sensitivity to BOLD signal changes in phase images and enables the visualization of phase activity maps highly co‐localized to magnitude (M/M0) activity maps. Magnitude and phase activity maps during visual task (P < 0.05 Bonferroni corrected) and at rest (P < 0.005 Bonferroni corrected, for display purposes only) for two subjects (two slices shown, red/green = positive/negative activity) obtained: (A) without and (B) and (C) with physiological noise correction (temporal drifts were removed in (A–C). The same noise regressors were employed in (B) and (C), with the following exception: the effects related to the phase of respiratory cycle were modeled by (B) four RETROICOR respiratory regressors, and (C) a single Φnoise‐regressor (derived from spatial polynomial fitting of phase images, polynomial order = 4). In (D), we show the percentage (mean ± standard error across subjects) of overlapping voxels between magnitude and phase activity maps relative to the number of voxels in magnitude activity maps (P < 0.05 Bonferroni corrected, for both conditions) with and without physiological noise correction (see legend). In 1, three to six data from eight subjects were pooled, in 2 only six subjects were included because of missing physiological recordings for two subjects. [Color figure can be viewed in the online issue, which is available at http://wileyonlinelibrary.com.]
