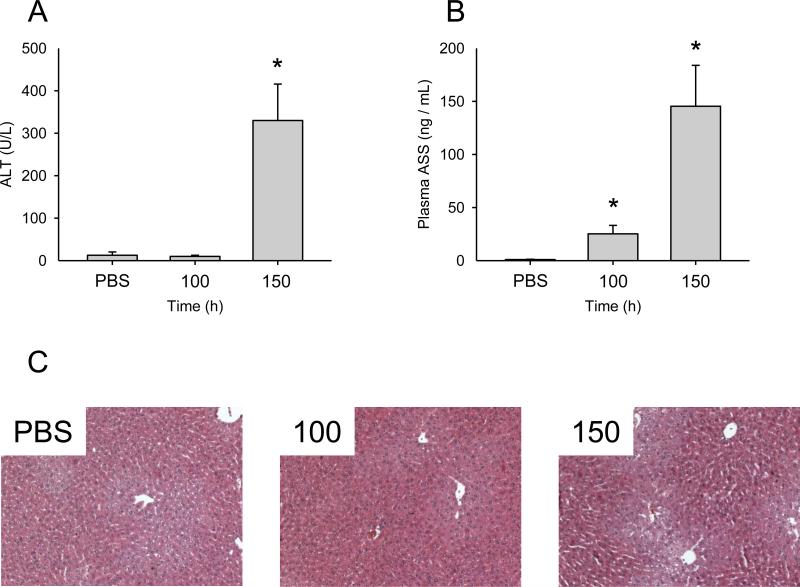
Figure 2.
Dose-response of plasma ASS and ALT in APAP-treated mice. Mice were treated with PBS vehicle, 100, or 150 mg/kg acetaminophen (APAP) and sacrificed 6 h later. (A) Plasma alanine aminotransferase (ALT). (B) Plasma argininosuccinate synthetase (ASS). (C) H&E stained liver sections from the 100 and 150 mg/kg APAP-treated mice. Data are expressed as mean ± SEM for n = 3-4. *p < 0.05 compared with PBS vehicle.

