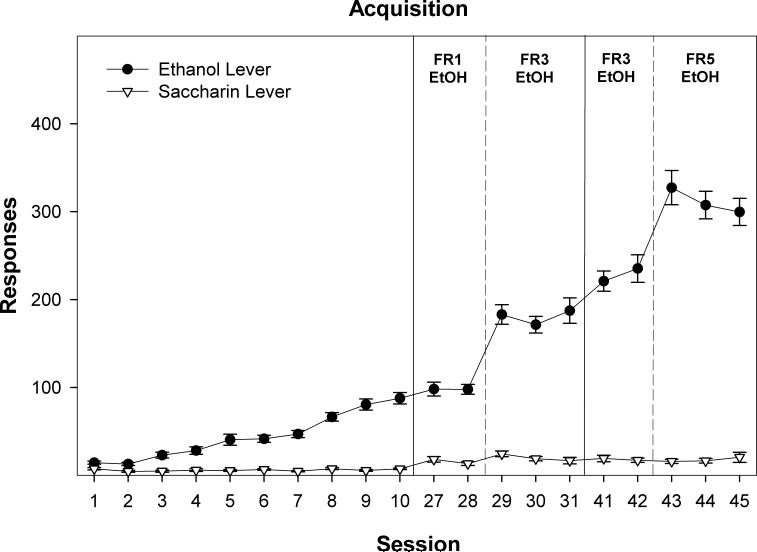
Figure 1.
Depicts the mean (± SEM) lever responses for P rats concurrently self-administering 15% EtOH and 0.0125 % saccharin (SACC). The graph also depicts the effects of increasing the work requirement for EtOH (FR1 increased to FR3, and then finally FR5) while the work requirement for SAC remained constant (FR1). As indicated in the graph, P rats preferred to self-administer EtOH from the 3rd session onward, regardless of the increase in the work requirement for EtOH (all p values < 0.002).

