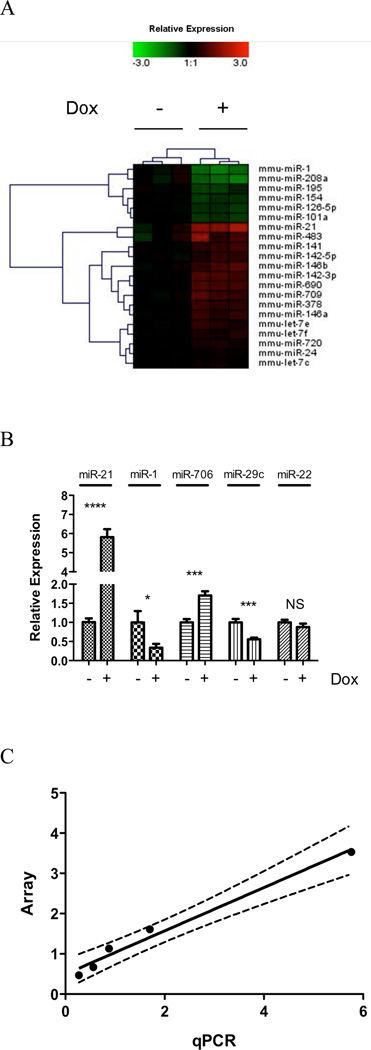
Figure 1. MiRNA expression profile in IL-13 transgenic mice lung.
(A) Heat map of 21 differentially expressed miRNAs following control no doxycycline (−) and doxycycline (+) exposure for 28 days. Relative expression is log2 transformed. (B) A qRT-PCR validation of a selected set of miRNA probes normalized to snoRNA202. NS, not significant; *, p < 0.05; ***, p < 0.001, ****, p < 0.0001. (C) Correlation of miRNA microarray and qRT-PCR validation; dashed line represents 95% confidence interval. Data are represented as mean ± S.E.M; n = 5–7 mice per group; data representative of 3 experiments.

