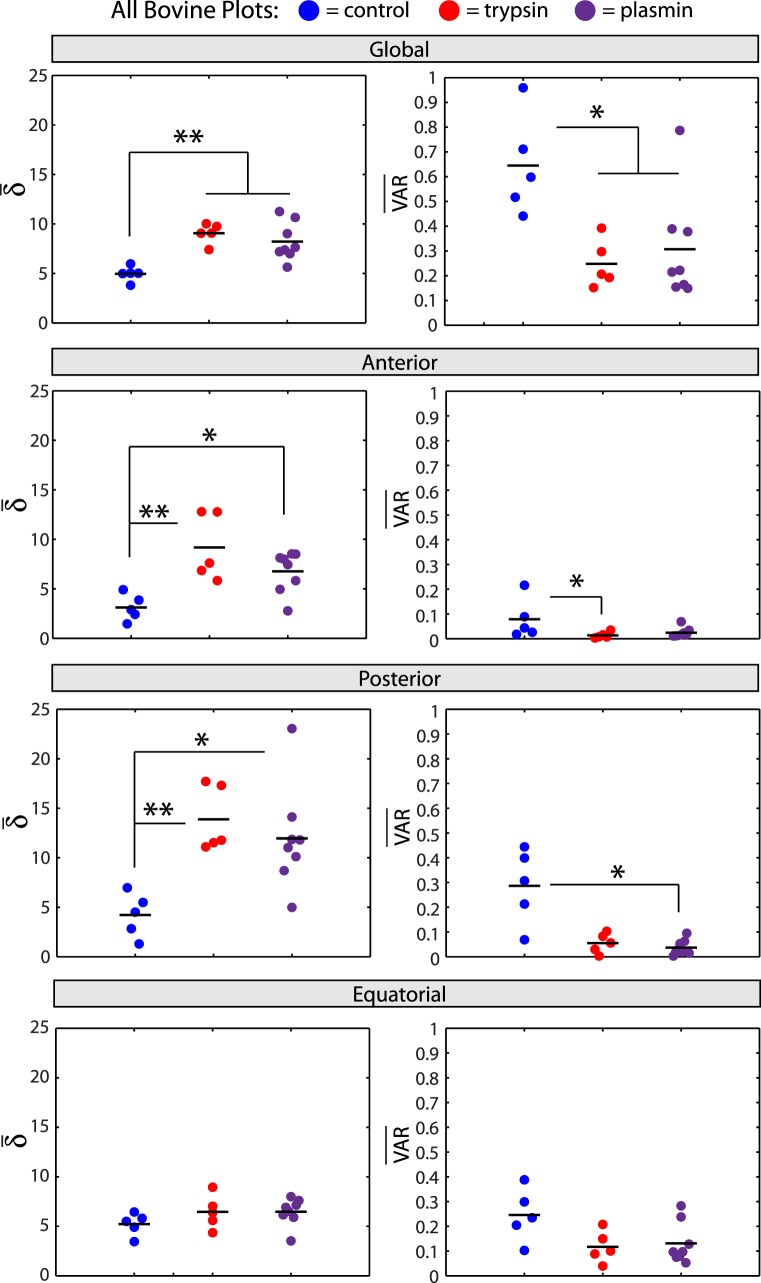
Figure 8.
Quantitative bovine vitreous comparison. Average retardation (δ̄) and circular variance (VAR) from all anterior-posterior bovine sections in the three treatment groups (control, blue; trypsin, red; plasmin, purple) and four sampling locations (global, top row; anterior, second row; posterior, third row; equatorial, bottom row) are shown. Fibers are significantly more aligned (P < 0.01) and homogeneously oriented (P < 0.05) in control relative to enzyme-treated vitreous (top row). This trend is the same in anterior and posterior vitreous (second and third rows, **P < 0.01, *P < 0.05), but no significant differences between groups are present in equatorial vitreous (bottom row).

