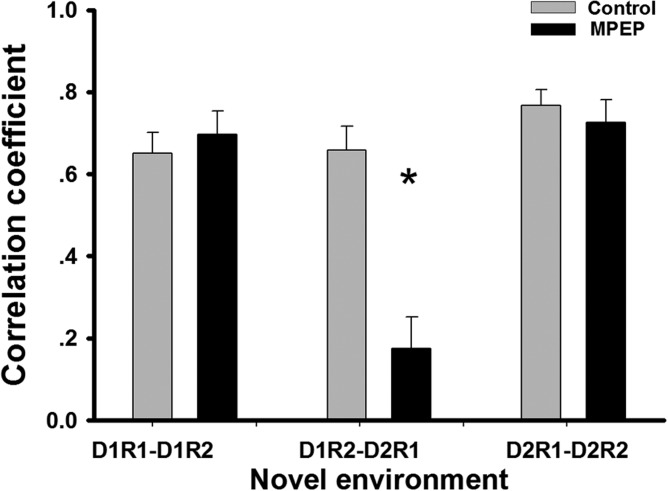
Figure 6.

Correlations of firing pattern in each trial-pair in the novel environment showed remapping 24 h after an initial exposure to a novel environment. The correlation coefficients were calculated from indicated trial-pairs in the novel environment. Significantly decreased spatial correlations were observed in the MPEP group in D1R2-D2R1, while those in other trial-pairs in the MPEP group were as high as those in the control group. Bar chart shows mean value ± SEM. (ANOVA + Fisher’s post hoc test; *: P < 0.05).
