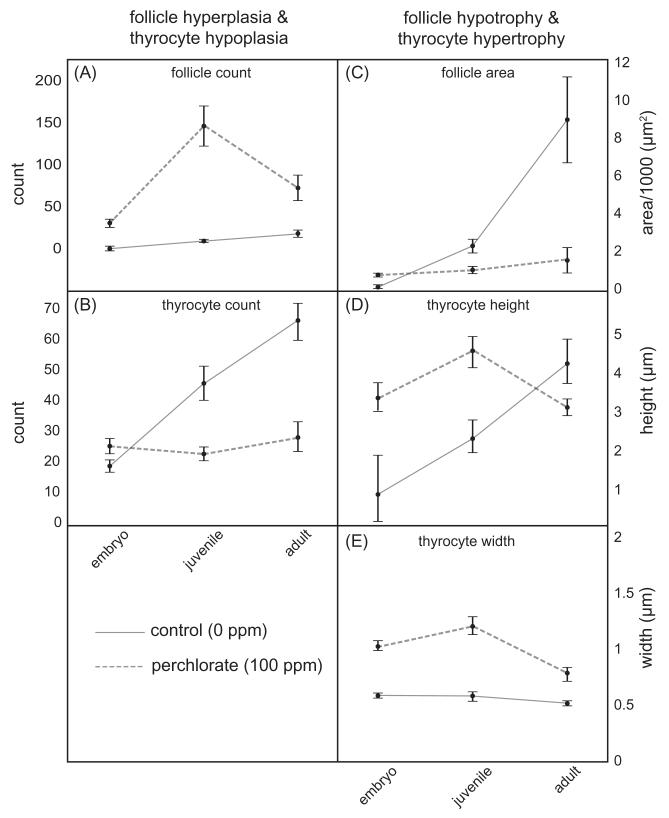
Fig. 3.
Morphometric analysis of the thyroid. (A) follicle count, (B) thyrocyte cell count, (C) follicle area, (D) thyrocyte height, and (E) thyrocyte width in larval (<100 dpf), juvenile (100–250 dpf), and adult (>250 dpf) stickleback exposed chronically to 0 ppm (control, 0 ppm, solid line) or 100 ppm perchlorate (perchlorate, 100 ppm, dashed line). n = 4–14 individuals for each treatment and age class. A significant interaction and model effect of perchlorate and age by one-way ANOVA (P < 0.05) was detected for each morphological character measured.

