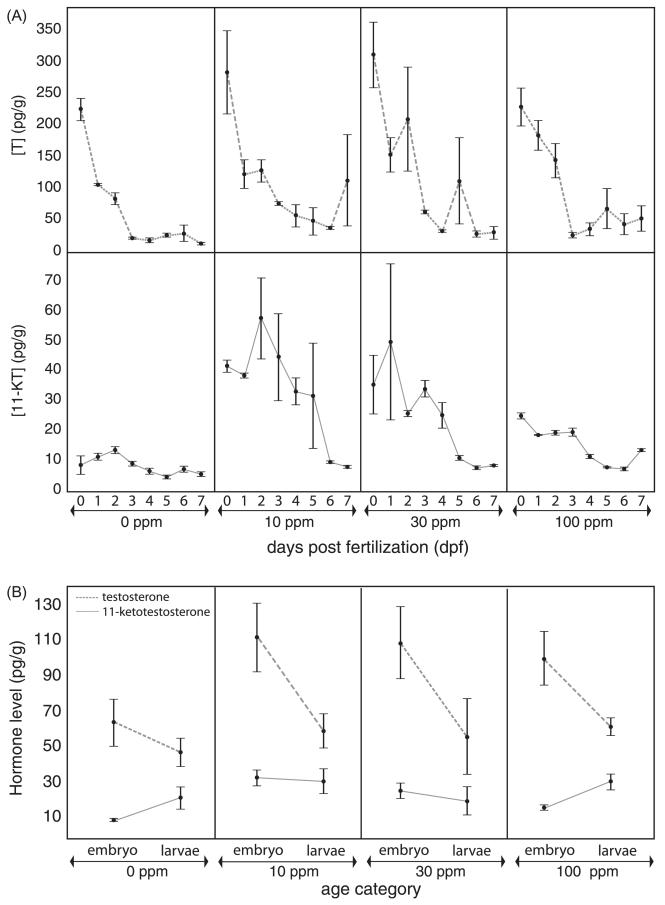
Fig. 4.
Androgen levels in perchlorate-treated and control stickleback. (A) Whole body [Testosterone] (T, pg/g) in embryonic stickleback at 0, 10, 30, and 100 ppm perchlorate exposure measured at 0, 1, 2, 3, 4, 5, 6, and 7 dpf. 0 dpf embryos have been exposed from fertilization until 3 h post fertilization. (B) Whole body [11-Ketotestosterone] (11-KT, pg/g) in development, with data pooled by biological life stage (embryos, 0–7 dpf, larvae, 8–56 dpf) n = 3–5 pools (biological replicates) of age matched fish (mass equal to 1 g). Results revealed a significantly different [11-KT] in embryos treated with 10 ppm and 30 ppm perchlorate. Dashed lines represent [T] and solid lines represent [11-KT] in embryos and larvae. Over the course of the first 56 dpf of development there is a significant interaction effect of perchlorate exposure and time post fertilization on 11-KT levels.

