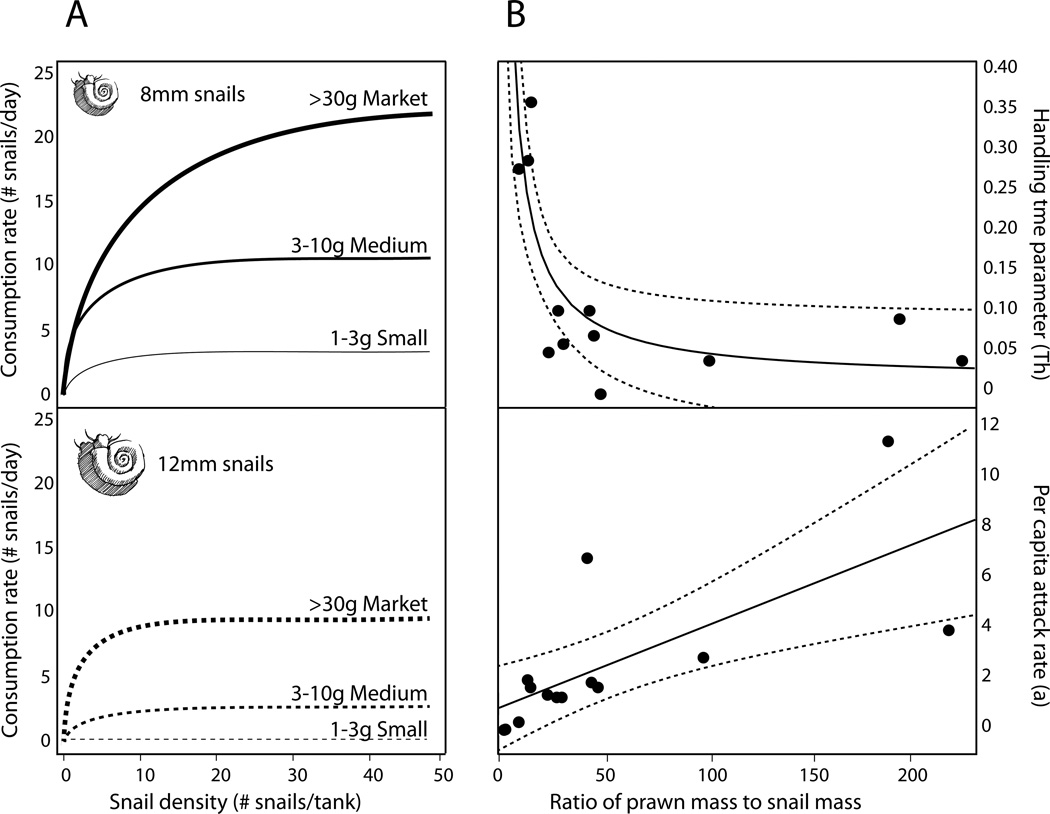
Figure 5.
(A) A subset of best fit functional response curves, based on least squares fitting of Holling’s disc equation for prawns of different size (Small = 1–3g prawns, Medium = 3–10g prawns, Market = >30g prawns) consuming B. glabrata snails of different size classes (8mm or 12mm ± 2mm shell length). (B) The relationship between the parameters governing the attack rate and handling time and prawn:snail body mass ratio, showing a predictable functional response. Data for M. vollenhovenii and M. rosenbergii preying on either B. glabrata or B. truncatus were combined to generate this figure.

