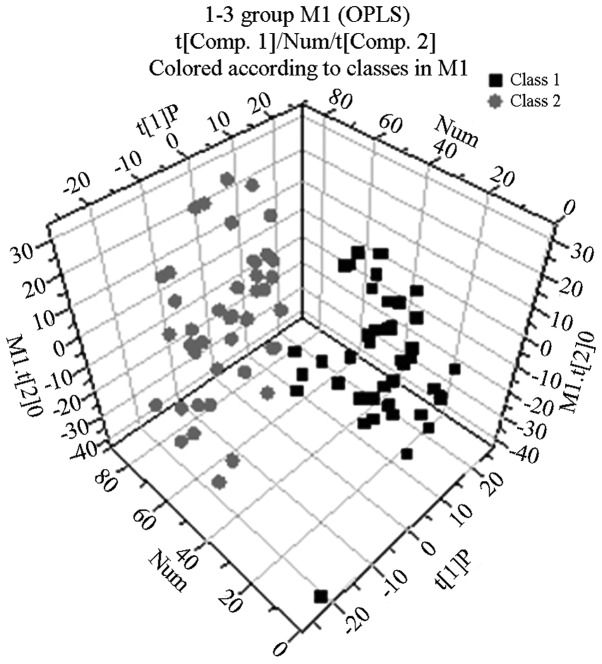
Figure 2.
OPLS-DA scatter plot generated from 1H nuclear magnetic resonance spectra of plasma from patients with chronic obstructive pulmonary disease with abnormal Savda syndrome (gray circles) and healthy controls (black squares). The model parameters were R2X[1]=0.153587, R2X[2]=0.230561, R2Y=0.83 and Q2=0.68. OPLS-DA, orthogonal projection to latent structure-discriminate analysis. t[1]P, the principal component of the three-dimensional figure; Num, the percentage of the principal component.

