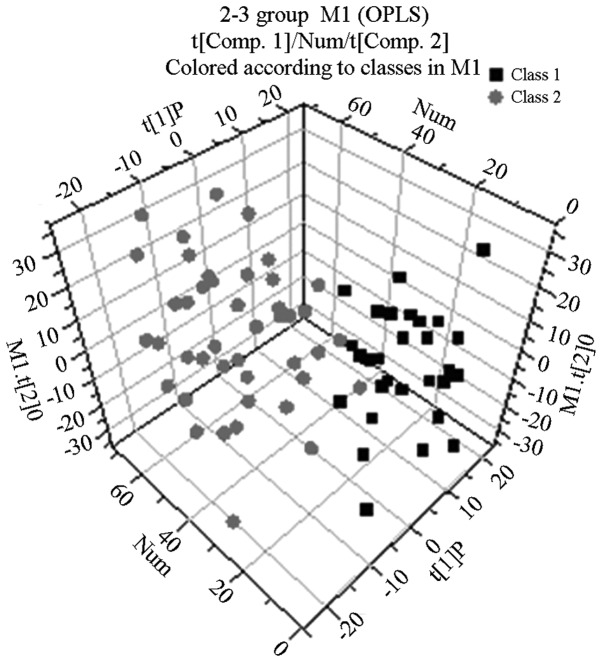
Figure 3.
OPLS-DA scatter plot generated from 1H nuclear magnetic resonance spectra of plasma from healthy controls (black squares) and patients with chronic obstructive pulmonary disease with non-abnormal Savda syndrome (gray circles). The model parameters were R2X[1]=0.13, R2X[2]=0.25, R2Y=0.83 and Q2=0.67. OPLS-DA, orthogonal projection to latent structure-discriminate analysis. t[1]P, the principal component of the three-dimensional figure; Num, the percentage of the principal component.

