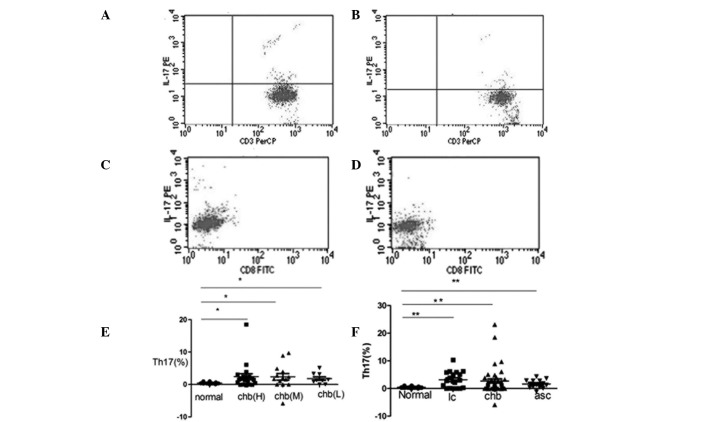
Figure 3.
Flow cytometric analysis of IL-17+ Th17 cells. The percentages in each figure represent the levels of the analyzed cell subsets. (A and C) Blood samples were stimulated with phorbol 12-myristate 13-acetate and ionomycin. (B and D) Blood samples were not stimulated. (E) Percentages of Th17 cells in the heavy, middle and low CHB groups and the normal control. (F) Percentages of Th17 cells in the normal, LC, CHB and ASC groups. *P<0.05 and **P<0.01. IL, interleukin; Th17, T helper 17; CHB, chronic hepatitis B; LC, liver cirrhosis; ASC, asymptomatic carrier.

