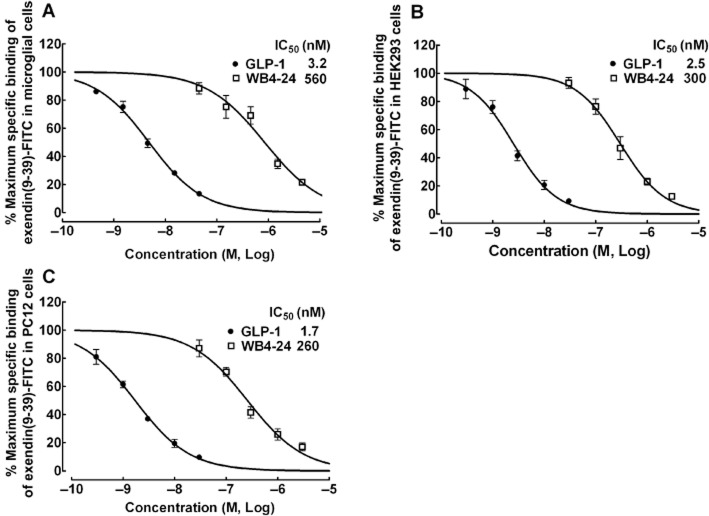
Figure 3.
Concentration–displacement response curves of WB4-24 and GLP-1 in the binding of exendin(9–39)-FITC in microglial cells (A), HEK293 cells (B) and PC12 cells (C). Exendin(9–39)-FITC (30 nM) was added with increasing concentrations of WB4-24 or GLP-1. The concentration response was analysed using the non-linear least squares method. The data are presented as means ± SEM (n = 3 in each treatment) from two independent studies.

