Figure 1.

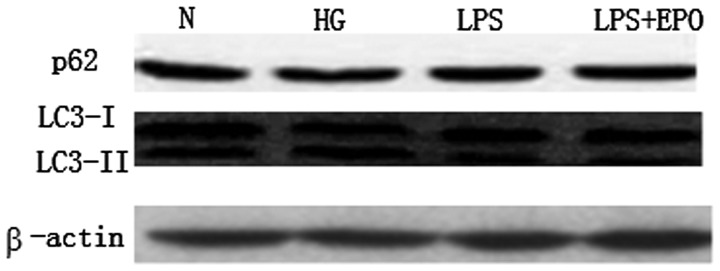
Western blot analysis of LC3 and p62/sequestosome-1 showed no significant differences among the groups after 24 h of culture. N, normal control; HG, high-glucose; LPS, lipopolysaccharide; EPO, erythropoietin.

Western blot analysis of LC3 and p62/sequestosome-1 showed no significant differences among the groups after 24 h of culture. N, normal control; HG, high-glucose; LPS, lipopolysaccharide; EPO, erythropoietin.