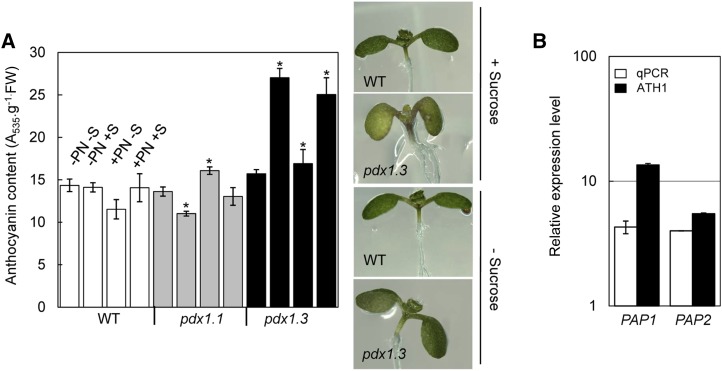
Figure 7.
Anthocyanin accumulation in pdx1.3. A, Anthocyanin levels in pdx1.1 and pdx1.3 compared with wild-type (WT) Col-0 in the presence or absence of pyridoxine (PN) and/or Suc (S). Seedlings were grown until 10 DAG. The data represent means from at least three biological replicates. Error bars represent se. Asterisks indicate statistically significant differences (P < 0.001) of mutant lines compared with the corresponding control wild-type line. The morphology of pdx1.3 in the presence or absence of Suc at this stage of growth is shown on the right compared with the wild type. B, Expression levels of PAP1 and PAP2 transcription factors involved in anthocyanin biosynthesis in pdx1.3 compared with wild-type Col-0. Transcript abundance was determined by both an ATH1 microarray (see text) and qPCR. In the case of the qPCR, the data are results of three biological replicates. Error bars represent se.

