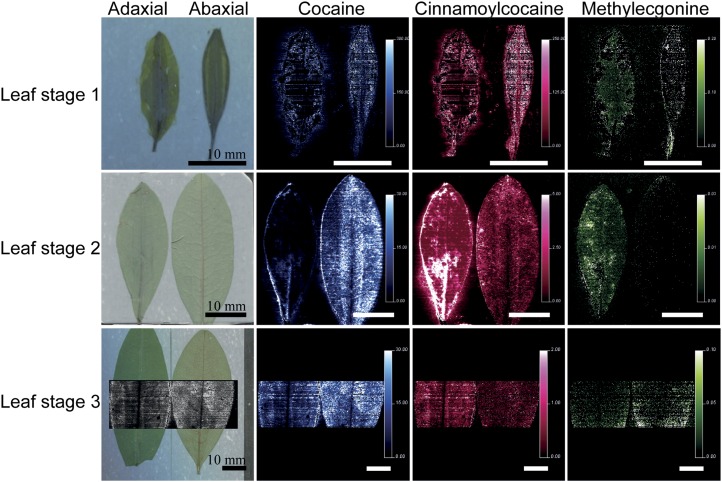
Figure 5.
MALDI MS imaging of E. coca leaves of different developmental stages for TAs. Optical images (left) and MALDI MS imaging of E. coca leaves of different developmental stages for TAs. MALDI-SRM/MS images are based on traces of spectra in the SRM mode specific for each TA. A black and white image based on the SRM trace for cocaine is overlaid on the optical image for L3, which corresponds to the area analyzed by MALDI for this sample and highlights details that can be expected with high spatial resolution MS imaging of intact leaves. Trace for cocaine is shown in blue at mass-to-charge ratio (m/z) 304 > m/z 182, cinnamoylcocaine trace is shown in pink at m/z 330 > m/z 182, and methylecgonine trace is shown in green at m/z 200 > m/z 182 in leaf stages L1 to L3. The images are displayed after normalization with the SRM trace of cocaine-d3 applied as a standard in solution with the matrix. The vertical color scale represents the respective SRM signal intensity ratio of the analyte over the reference compound cocaine-d3: White pixels give the highest signal, whereas dark pixels give the lowest signal. Horizontal bars represent a 10-mm scale for each image. MS image resolution is pixels of 50 × 50 µm.

