Figure 3.
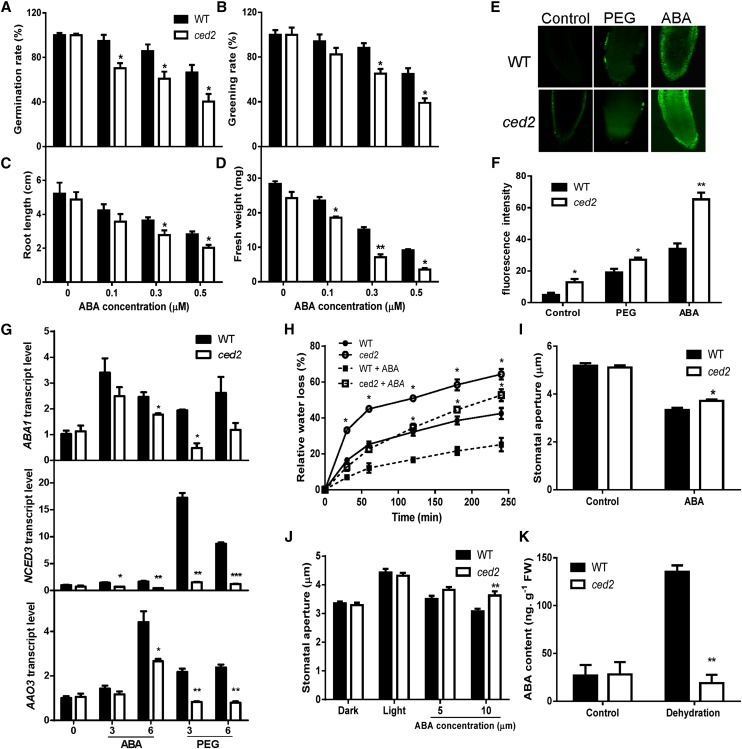
Stress and ABA responses in the ced2 mutant. A, Seed germination rate on MS agar plates supplemented with different concentrations of ABA at 4 d after seed imbibition. Four replicates were performed with about 100 seeds per genotype for each replicate. B, Greening rate of seedlings on ABA-supplemented MS agar plates at 8 d after seed imbibition. Four replicates were performed. C, Fresh weight of seedlings on ABA-supplemented MS agar plates at 2 weeks after seed imbibition. Six plants were pooled together for weight measurement per replicate. Three replicates were performed. D, Root growth of seedlings on ABA-supplemented MS agar plates at 2 weeks after seed imbibition. Three replicates were performed. E, Representative images of ROS production stained with the fluorescent dye H2DCF-DA in root tips under the control (left), PEG (middle), and ABA treatment (right). F, Quantification of relative ROS production based on fluorescence pixel intensity. Three replicates were performed with 10 seedlings for each genotype per replicate. G, qRT-PCR analysis of transcript levels of ABA1, NCED3, and AAO3 in seedlings under ABA and PEG treatments. Real-time reverse transcription-PCR quantifications were normalized to the expression of UBQ3. The transcript level in Col-0 under the control conditions was set to 1.0. H, Transpirational water loss of detached leaves. Soil-grown plants were sprayed with water or 50 μm ABA, and leaves were detached 4 h later for measuring water loss at the indicated time. I, Stomatal aperture at 2.5 h after 10 μm ABA treatment. J, Inhibition of light-induced stomatal opening by ABA. K, ABA content of ced2 and wild-type seedlings after dehydration treatment for 2 h. Three replicates were performed. Black bars indicate the wild type (WT), and white bars indicate ced2 mutant. In I and J, at least 120 stomata were analyzed. Data in A to D and F to K represent means ± se. *P < 0.05 and **P < 0.01.

