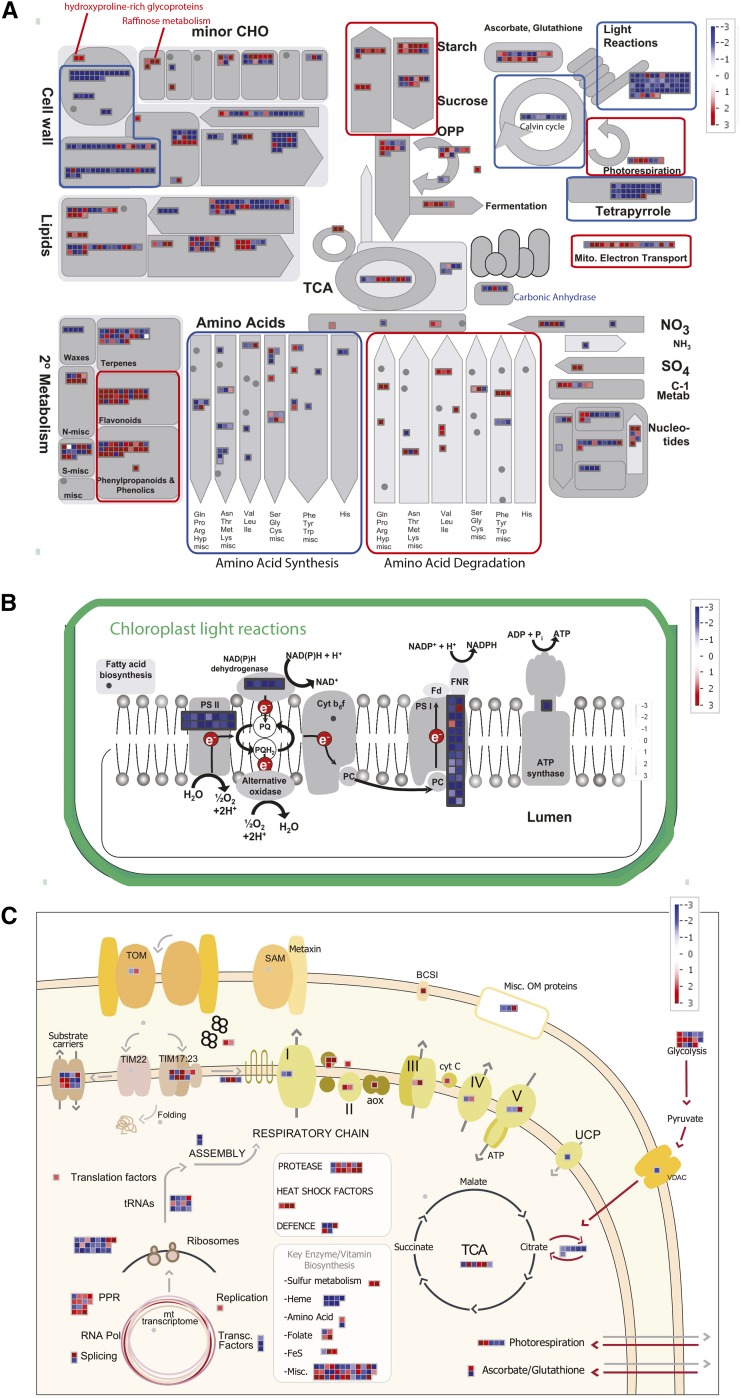
Figure 3.
MapMan overview of transcriptional changes in response to MLD stress in both rpoTmp and aox1a plants compared with respective untreated mutants. Fold changes for transcripts that showed common responses to MLD stress in both aox1a and rpoTmp plants were averaged in abundance and plotted on MapMan images for an overview of metabolism (A), chloroplastic photosynthetic electron transport chain (ETC) function (B), and a custom image generated for a comprehensive overview of mitochondrial function (C; Law et al., 2012). Red and blue boxes indicate up-regulated and down-regulated transcripts, respectively, according to the color scale for log2 fold changes. CHO, Carbohydrate; Fd, ferredoxin; FNR, ferredoxin reductase; PC, plastocyanin; TOM, translocase of the outer membrane; SAM, sorting and assembly machinery of the outer membrane; BCS1, cytochrome bc1 synthesis1; Misc. Om, miscellaneous outer membrane; UCP, uncoupling protein; VDAC, voltage-dependent anion channel; cyt C, cytochrome c; mt, mitochondria; Pol, polymerase.

