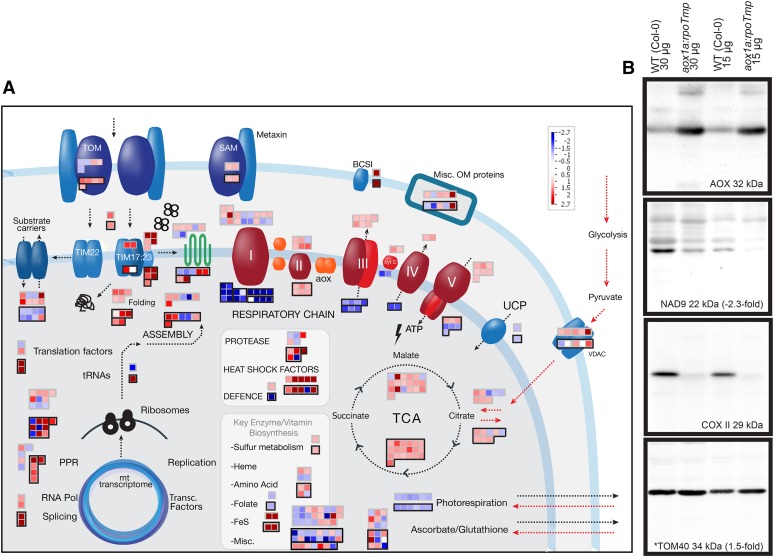
Figure 8.
Summary of mitochondrial protein changes in aox1a:rpoTmp under standard growth conditions. A, A customized MapMan image representing various mitochondrial functions is shown. Changes in protein abundance are shown by red (up) or blue (down) squares that are outlined in black, with the corresponding transcripts above. B, Western-blot analysis of selected mitochondrial proteins in aox1a:rpoTmp under standard growth conditions; 15 and 30 μg of purified mitochondrial proteins were isolated from wild-type (Col-0) and aox1a:rpoTmp plants and probed with antibodies as indicated. Representative proteins from various functional groups were examined, and example outputs are shown for Tom40 representing protein import components and AOX from the alternative respiratory pathway, NAD9 (complex I), and COXII (complex IV). *, Proteins were also detected in the quantitative proteomic analysis, and the fold changes in the mutant are indicated. WT, Wild type; TOM, translocase of the outer membrane; SAM, sorting and assembly machinery of the outer membrane; Misc OM, miscellaneous outer membrane proteins; BCS1, cytochrome bc1 synthesis; cyt C, cytochrome c; UCP, uncoupling protein; VDAC, voltage-dependent anion channel; Pol, polymerase.

