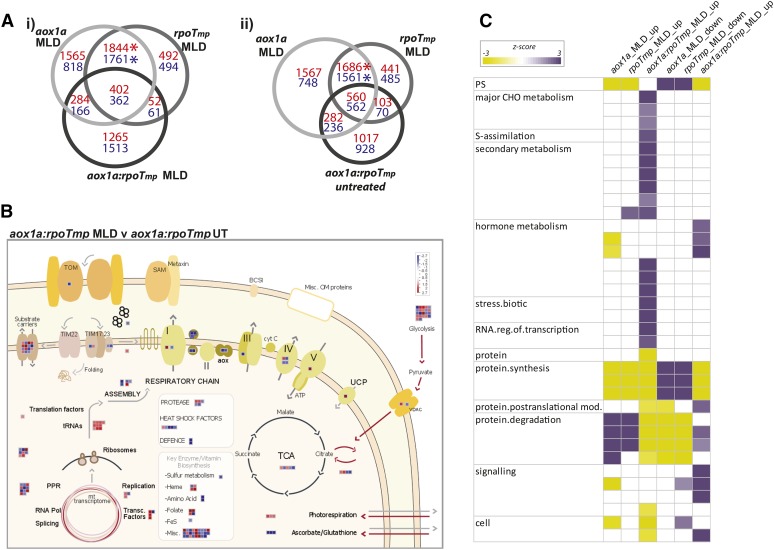
Figure 9.
Overview of the transcriptome response of aox1a:rpoTmp to adverse growth conditions in comparison with untreated mutants, the wild type (Col-0), and single mutants. A, The number of transcripts of genes that increased (red) or decreased (blue) in abundance in aox1a or rpoTmp grown under MLD stress and the overlap with aox1a:rpoTmp grown under MLD stress (i) or untreated conditions (ii). Asterisks indicate a significant overlap as determined by a Pearson's chi-squared test. B, The changes in transcript abundance of genes encoding mitochondrial proteins in aox1a:rpoTmp grown under adverse environmental conditions. C, A Pageman visualization showing the overrepresented functional categories for genes with transcripts that differed in abundance in all three mutants grown under MLD stress. Note that only the functional categories overrepresented in the aox1a:rpoTmp double mutant are shown. The full Pageman output for this analysis is shown in Supplemental Figure S3. CHO, Carbohydrate; TOM, translocase of the outer membrane; SAM, sorting and assembly machinery of the outer membrane; BCS1, cytochrome bc1 synthesis; Misc OM, miscellaneous outer membrane proteins; cyt C, cytochrome c; UCP, uncoupling protein; UT, untreated; VDAC, voltage-dependent anion channel; Pol, polymerase.

