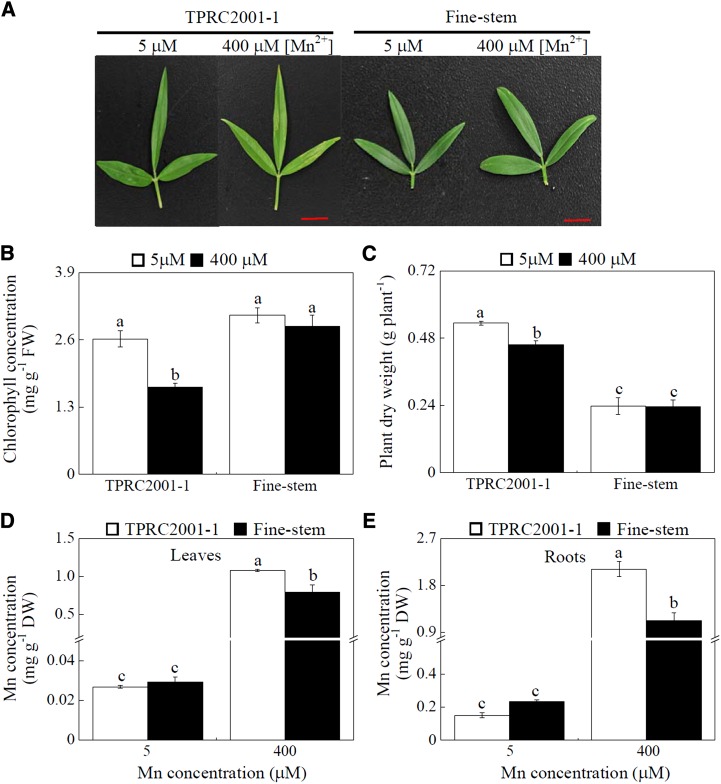
Figure 1.
Growth and Mn concentrations of two S. guianensis genotypes at two Mn treatments. A, Leaves of S. guianensis after 10 d of Mn treatment. B, Leaf chlorophyll concentrations. C, Plant dry weight. D, Leaf Mn concentrations. E, Root Mn concentrations. S. guianensis seedlings were grown under normal conditions for 1 month and then treated with 5 or 400 µm MnSO4 for 10 d. F values of ANOVA analysis are as follows: B, 31.7 for genotype (P < 0.001), 15.6 for Mn treatment (P < 0.05), and 6.1 for interaction between genotype and Mn treatment (P < 0.05); C, 164.7 for genotype (P < 0.001), 3.86 for Mn treatment (no significant difference at the P = 0.05 level) and 3.38 for interaction between genotype and Mn treatment (no significant difference at the P = 0.05 level); D, 8.6 for genotype (P < 0.05), 356.4 for Mn treatment (P < 0.001), and 8.9 for interaction between genotype and Mn treatment (P < 0.05); and E, 19.3 for genotype (P < 0.001), 368.5 for Mn treatment (P < 0.001), and 29 for interaction between genotype and Mn treatment (P < 0.05). Each bar represents the mean of four independent replicates with se. Different letters indicate a significant difference at the P = 0.05 level. DW, Dry weight; FW, fresh weight. Bars = 1 cm.

