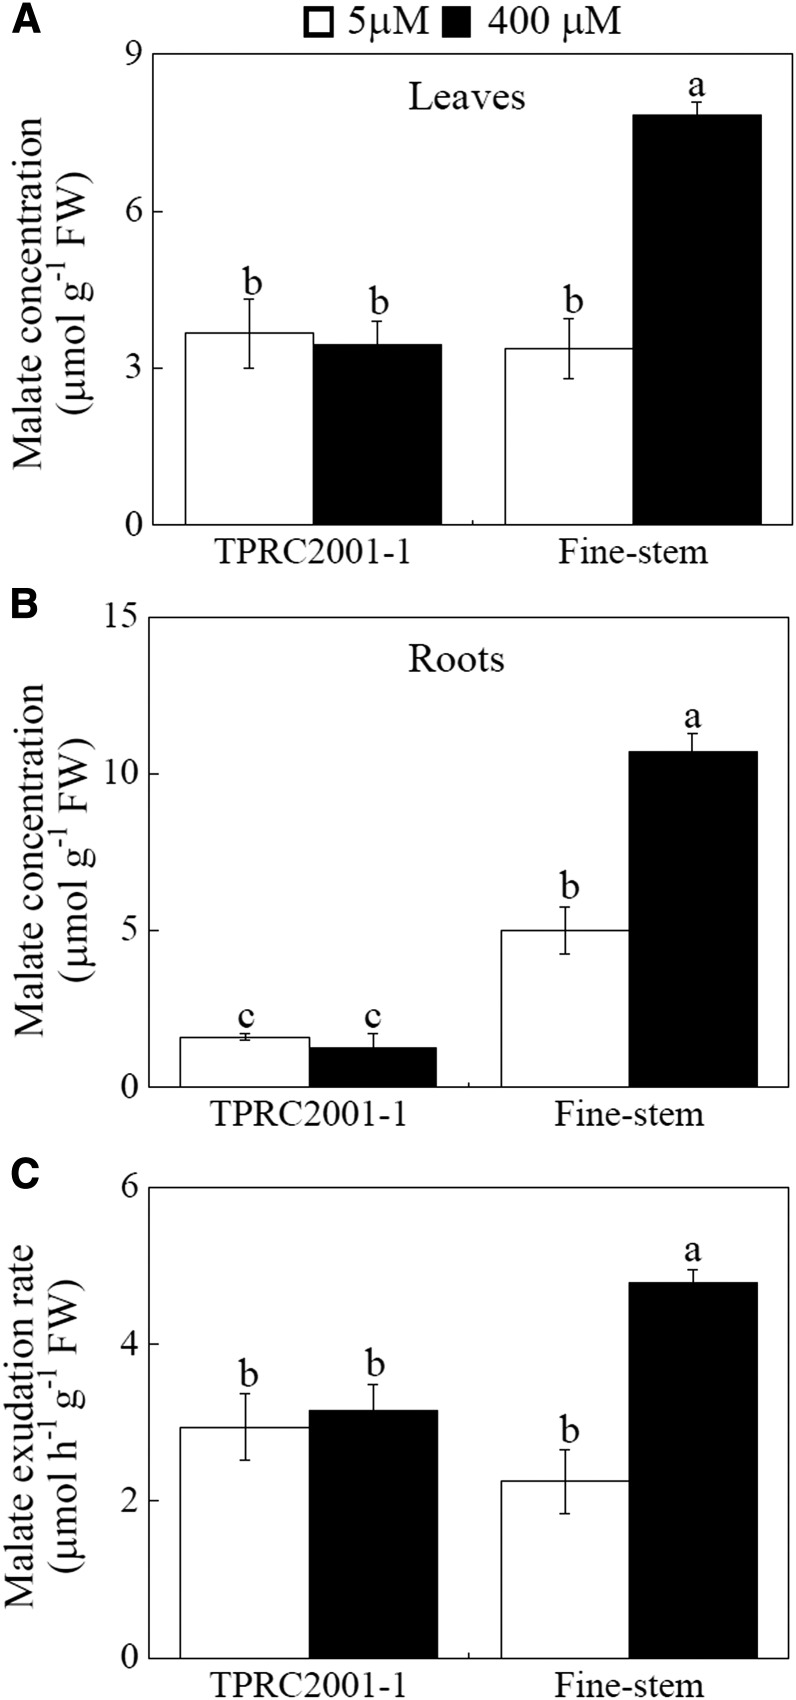
Figure 2.
Malate concentrations and exudation in S. guianensis at two Mn levels. A, Malate concentrations in leaves. B, Malate concentrations in roots. C, Malate exudation from roots. S. guianensis seedlings were separately treated with 5 or 400 µm MnSO4. After 10 d, seedlings were transplanted into 40 mL of fresh nutrient solution to collect root exudates for 6 h. F values of ANOVA analysis are as follows: A, 16 for genotype (P < 0.05), 16.9 for Mn treatment (P < 0.05), and 20.9 for interaction between genotype and Mn treatment (P < 0.05); B, 148.5 for genotype (P < 0.001), 25.7 for Mn treatment (P < 0.05), and 33.1 for interaction between genotypes and Mn treatment (P < 0.001); and C, 2.2 for genotype (no significant difference at the P = 0.05 level), 18.8 for Mn treatment (P < 0.05), and 13.5 for interaction between genotype and Mn treatment (P < 0.001). Each bar represents the mean of four independent replicates with se. Different letters indicate a significant difference at the P = 0.05 level. FW, Fresh weight.

