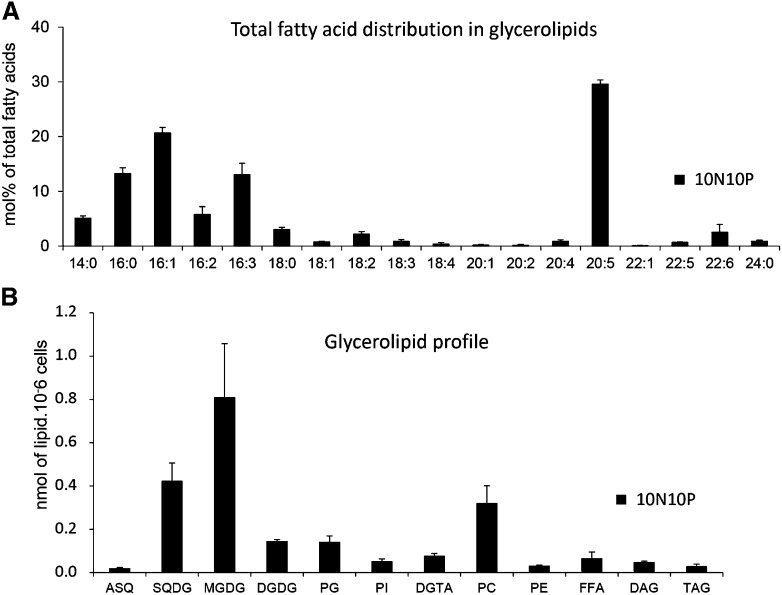
Figure 4.
Quantitative analysis of P. tricornutum glycerolipids. Lipids from Pt1 cells grown in a replete medium (10N10P) were extracted, separated by TLC, and analyzed as described in “Materials and Methods.” A, Global FA profile in a total lipid extract. FA proportions are given in percentages. B, Quantitative analysis of the various glycerolipids identified after TLC separation. Glycerolipids are expressed in nmol 10−6 cells and not as the summed FA content in each class. Each result is the average of three biological replicates ± sd. ASQ, 20:5-Acyl-SQDG; FFA, free FAs.

