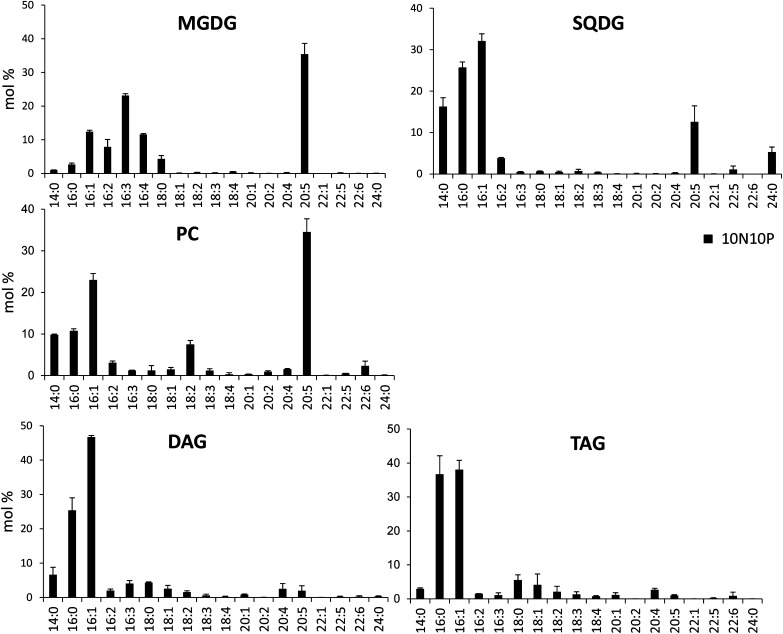
Figure 5.
Molar profiles of FAs in PC, DAG, TAG, MGDG, and SQDG. Lipids from Pt1 cells grown in a replete medium (10N10P) were extracted, separated by TLC, and analyzed for their FAs as described in “Materials and Methods.” Note that a cross contamination is possible between SQDG and PC due to the proximity of the TLC spots, leading to moderate enrichment of 20:5 in SQDG and 14:0 in PC. Each result is the average of three biological replicates ± sd.

