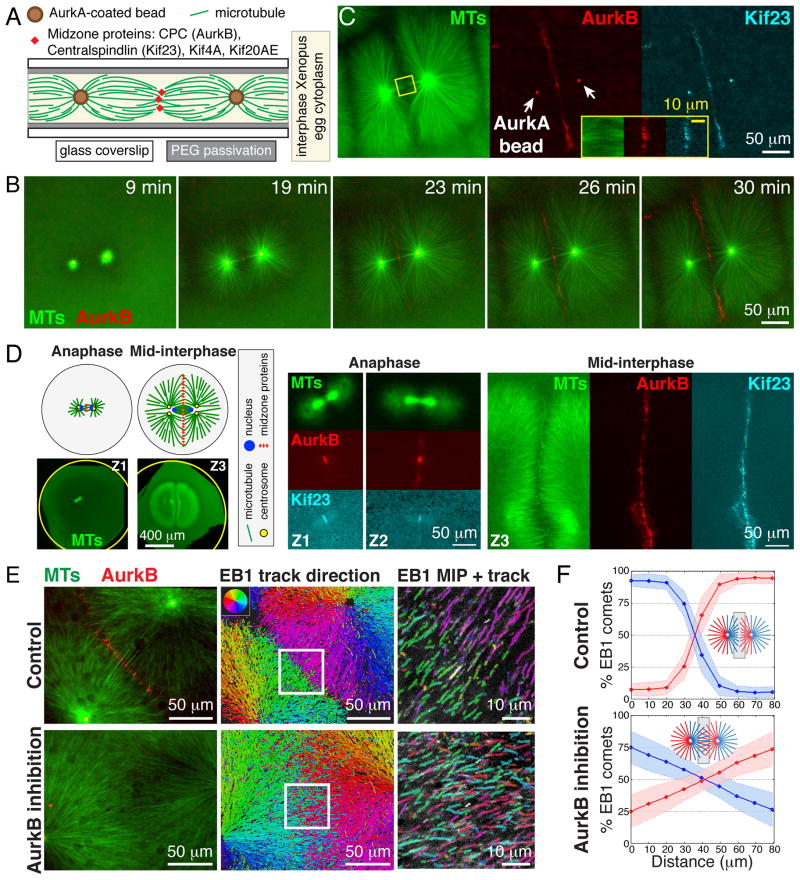
Fig. 1. Aster outgrowth and interaction in Xenopus egg cytoplasm.
(A) Experimental setup. See (5) for methods and probes. (B) Widefield time-lapse showing recruitment of AurkB (red) to an AAIZ. (C) AAIZ at 30 min (widefield) showing recruitment of AurkB (CPC subunit, red) and Kif23 (Centralspindlin subunit, cyan). (D) Localization of MTs (green), AurkB (red) and Kif23 (cyan) in Xenopus zygotes fixed at consecutive stages of the first cell division (Z1–Z3) imaged by laser scanning confocal microscopy (5). (E) Quantification of microtubule orientation using EB1 tracking. Left: Spinning disc confocal images of control (top) and AurkB inhibited (bottom) AAIZs. Middle: Map of EB1-GFP trajectories. Right: 4X zoom-up of square in middle panel with maximum intensity projection (MIP) of EB1 tracks (over 15 sec). (F) Spatial distribution of EB1 tracks at AAIZs classified by direction (shading indicates standard deviations determined from N≥5 zones). (See fig. S2, S3, and (5) for data analysis.)

