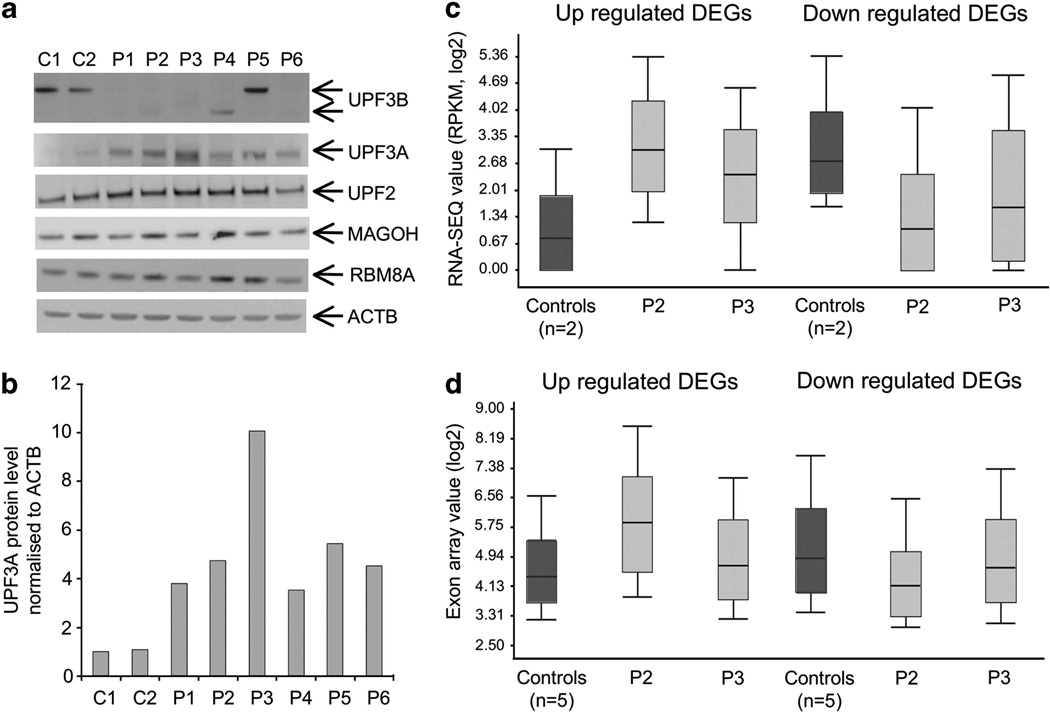
Figure 2.
Upregulation of UPF3A protein rescues loss of UPF3B function. (a) Western-blot analysis of UPF3B, UPF3A, UPF2, MAGOH and RBM8A. Protein lysates from two controls and six patients are shown. Full-length UPF3B protein can only be detected in controls and patient 5 (carrying a missense mutation) (top panel). UPF3A is expressed at very low level in controls and upregulated in all patients (second panel). Lower panels show full-length UPF2, MAGOH and RBM8A at comparable levels between controls and patients. ACTB (bottom panel) was used as loading control. These blots are representative of two independent experiments. (b) UPF3A protein is stabilized at different levels in different UPF3B patients. Densitometry was performed directly on image captured with low exposure time and normalized against the level of the ACTB protein in the same sample. Value was averaged from two images, and is representative of two independent experiments. (c) Box plot showing expression profiles of all upregulated differently expressed genes (DEGs) (320 genes) and downregulated DEGs (206 genes) as determined by RNA-SEQ in controls (n = 2, dark-gray bar) and patient 2 and 3 (light-gray bar). These two patients are siblings with the same mutation in UPF3B but have markedly different phenotypes (Supplementary Table S1). Notably, the extent of overall deregulation in each patient appears to be inversely proportional to the level of UPF3A stabilization as shown in panels a and b. (d) Similar trend in expression deregulation, as described in panel c, in patient 2 and 3 (light-gray bar) was also seen by exon array for all upregulated DEGs (279 genes) and downregulated DEGs (184 genes) when compared with the controls (n = 5, dark gray bar).

