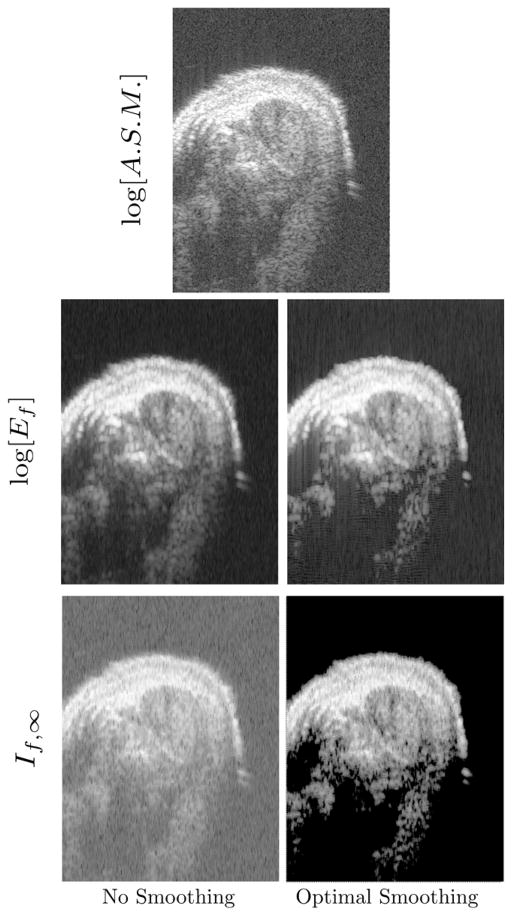
Figure 2.
An illustration of representative mdx-saline (positive-control) mouse biceps cross sections. The image depicted in the top row is conventional grayscale [i.e., logarithm of the analytic signal magnitude (ASM)]. The second row are log[Ef] images obtained using the same RF data using (left) unsmoothed or (right) optimal smoothing splines. The bottom row shows the corresponding If,∞· images. The direction of insonification is from the top.

