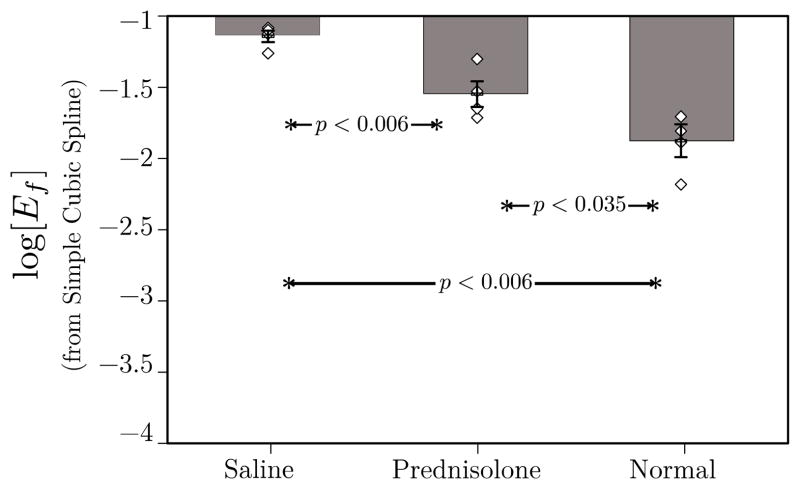
Figure 6.
Plot of mean log[Ef] for the three groups in this study. Individual data points for each member of each group are also shown to give an indication of the scatter in the data. These data were obtained using (2) in conjunction with optimal smoothing cubic splines. As in Fig. 4, log[Ef] operating on optimally smoothed data are able to differentiate all three groups. This result may be compared with that shown in Fig. 5 of a previous study that was based on unsmoothed RF. In that case, log[Ef] was unable to differentiate prednisolone-treated from untreated groups.[10]

