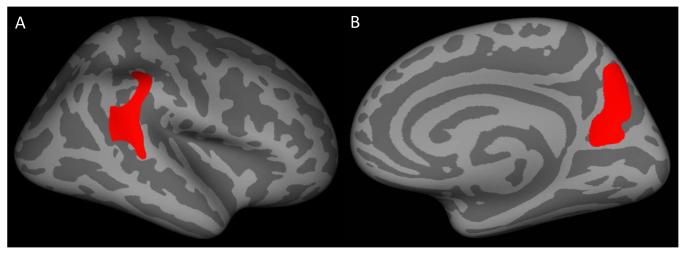
Figure 2.
Inflated surface maps (dark gray=sulci; light gray=gyri) of the surviving clusters (p<.05) showing thinner cortex in the IQ-matched sample of youths with conduct disorder as compared to typically developing controls: (A) right superior temporal cortex and (B) right precuneus. Note: See Table S2, available online, for information on the surviving clusters.

