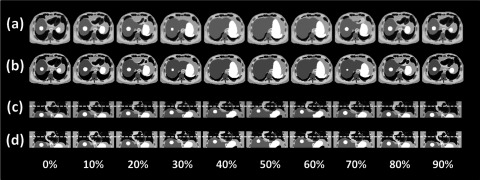
FIG. 10.

Comparison between (a) the original 10-phase 4D-XCAT phantom images and (b) the simulated 10-phase 4D-MRI images of the 4D-XCAT phantom in axial view; comparison between (c) the original 10-phase 4D-XCAT phantom images and (d) the simulated 10-phase 4D-MRI images of the 4D-XCAT phantom in coronal view; dashed lines were added for better visualization of motion. Minimal sorting artifacts were observed in certain phases of the simulated 4D-MRI images.
