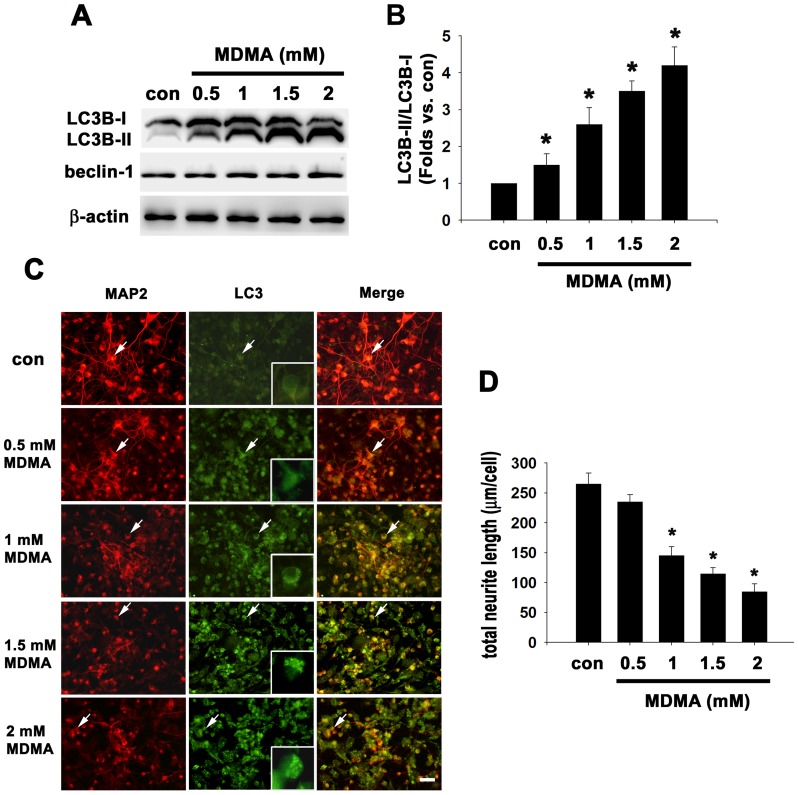
Figure 2. Dose dependence of MDMA-induced autophagy activation and neurite degeneration in cortical neuron culture.
Cultured cortical neurons were treated with the indicated concentrations of MDMA for 48 h, and then western blot analysis and double immunofluorescence were performed. (A) Western blot analysis of LC3B and beclin-1. β-actin was used as the internal control. (B) Densitometry of LC3B-II/LC3B-I ratio. Quantitative data are expressed as intensity relative to the control mean value (mean ± S.D.). n = 3, *P<0.05 vs control. (C) Double immunofluorescence stained images and merged images of representative cells using anti-LC3B and anti-MAP2. Bar = 30 µm. Intense LC3 punctate fluorescence shown in the MDMA-treated group (see insets). (D) Quantitation of neurite outgrowth. The total neurite length are shown as mean ± S.D., n = 3 experiments with 200–300 cells per experiment, *P<0.05 vs control.

