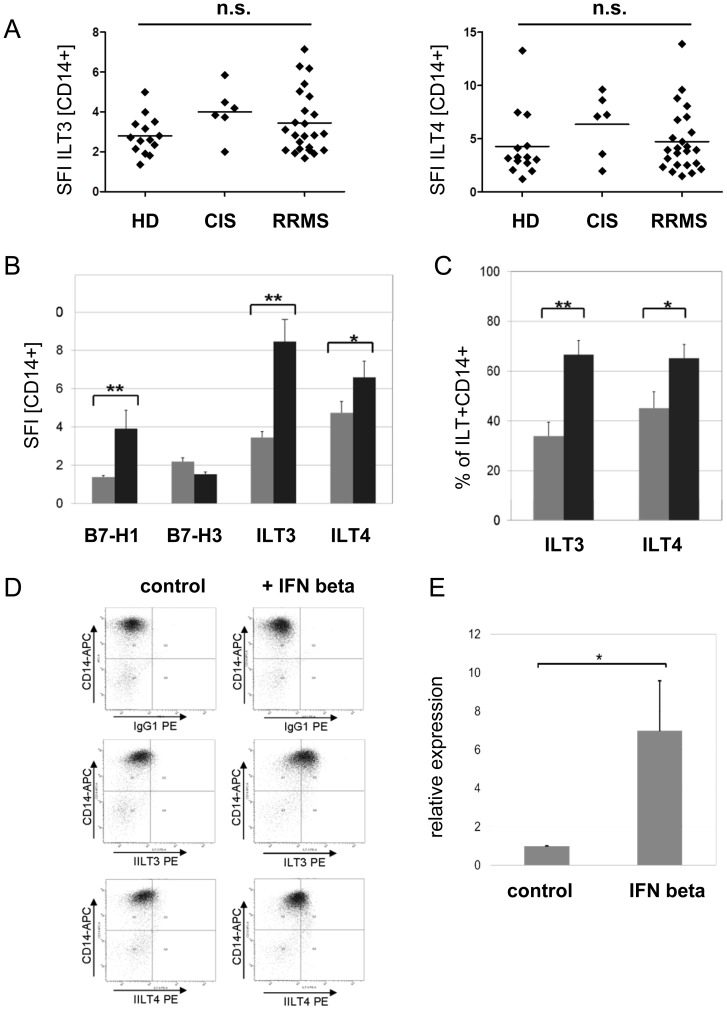
Figure 1. IFN beta induces ILT3 and ILT4 expression in monocytes.
(A) The baseline expression of the immune inhibitory receptors ILT3 and ILT4 on peripheral blood derived CD14+ monocytes assessed by comparing the specific fluorescent index (SFI = geo mean ILT/geo mean IgG1) does not differ significantly between RRMS (n = 24) or CIS patients (n = 6) and healthy donors (HD, n = 14) as demonstrated by flow cytometry. (B) In vitro IFN beta (1000IE/ml, 16 h) treatment induces ILT3 and to a lesser extent ILT4 protein expression in CD14+ monocytes from RRMS patients (n = 24). In addition the monocytic expression of the coinhibitory B7 family member B7-H1 is upregulated, whereas B7-H3 is not significantly affected. The specific fluorescent index is shown (grey bar: control; black bar: IFN beta). (C) The percentage of CD14+ monocytes expressing the immune inhibitory ILT is strongly increased following incubation with IFN beta as assessed by flow cytometry (n = 24; grey bar: control; black bar: IFN beta 1000 IE/ml, 16 h). (D) A representative flow cytometry experiment is shown. Please note, for simplification the isotypic control for ILT4 (IgG2a) is not shown in this picture. (E) IFN beta induces ILT3 mRNA in purified CD14+ monocytes derived from healthy donors (n = 6). Relative expression of ILT3 mRNA was assessed by quantitative PCR (Mann-Whitney U test; * p<0,05, ** p<0,005; bars are presented as mean ± S.E.M)

