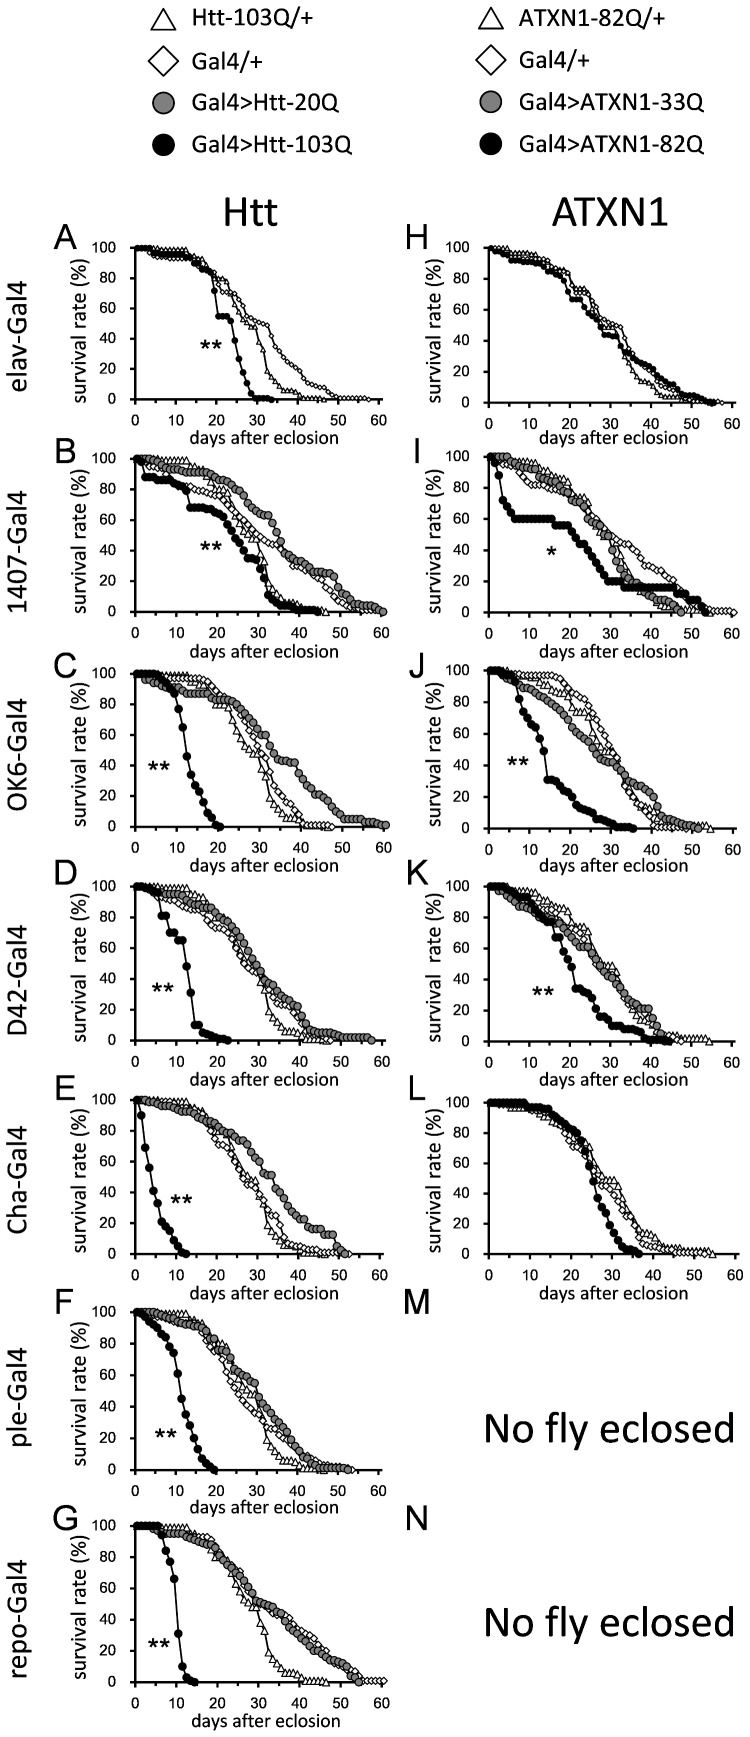
Figure 2. The longevities of each model and the genetic controls are indicated.
The X-axis is the number of days, and the Y-axis is the survival percentage. The UAS-Htt-103Q or 20Q flies crossed with the drivers are shown in A–G, and the UAS-ATXN1-82Q or 33Q flies crossed with the drivers are shown in H–N. The name of the driver used is indicated on the side of each graph. The numbers of flies tested are listed in S1 Table. The results of the statistical analyses are listed in S3 Table.

