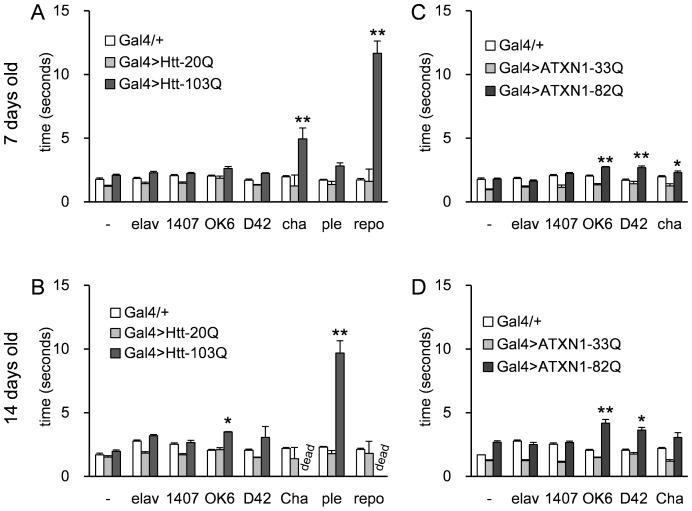
Figure 3. The motor performance was estimated using a negative geotactic assay.
The HD models (A, B) and the SCA1 models (C, D) were tested at 7 days (A, C) and 14 days (B, D). Each Gal4 driver tested is listed along the X-axis. “-” on the X-axis corresponds to “no driver” controls. The Y-axis represents the time to reach 5 cm (seconds). Each bar represents the mean ± SE. Single or double asterisks indicate significant differences (p<0.05 or p<0.01, respectively). The numbers of flies tested in each experiment (between 7 and 20) are listed in S1 Table. For each of the disease models that expressed Htt-103Q or ATXN1-82Q we tested about 20 flies. Because the short Q controls showed stable performance we only about 8 flies for each group. The results of the statistical analyses are listed in S4 Table.

